Performance Test Plots - to track performance regressions
Warning: this page is stale. Performance test results are now displayed at chromeperf.appspot.com.
See:
Chromium's buildbot runs a battery of performance tests on each build it produces. These performance test results are collected and viewable on the web to help Chromium developers study how the project's builds perform over time. By adding new tests, tuning existing tests, and configuring monitors to alert developers to unexpected conditions (such as regressions or speedups), the Chromium project continually improves its overall code quality. This document explains how that performance testing system functions and how changes can be introduced.
Gathering performance results
Each performance test is run by buildbot by executing that test's harness. The harness sets up the initial conditions for the test, runs the test (maybe repeatedly), and reports results on the program's standard output. You can build and run a test harness on your system -- these are the same programs the buildbot runs to measure performance. Note that your performance results could vary considerably from what the Chromium project's test systems report.
A sample performance plot
Test runs can be simple -- "test the amount of time it takes to switch between two tabs" -- or complicated -- "test warm/cold startup performance with/without themes." Most of the tests run by the buildbot are pretty straightforward, but the performance test output can be hard to use at first. Let's look at the most complicated kind of performance test, a page-cycler test, as an example. The page-cycler tests take a set of URLs that have been saved to local files to eliminate the network as a source of performance noise, and load them several times each, tracking various data. Find a "Perf" builder, scroll down to any page_cycler step, and click the "results" link. You'll see a plot like this one:
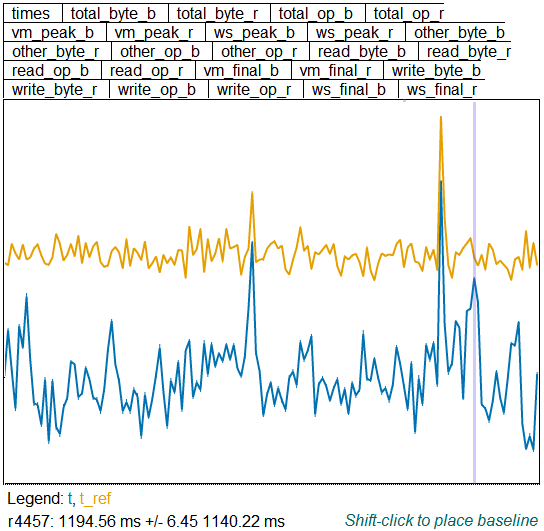
The boxes along the top list the different graphs available, one for each kind of data that was collected by the page_cycler test. Click on one to see that information plotted. Here's what all the pieces of the names mean:
| times | time in milliseconds to load each page once |
| _b | a data point collected from the browser process |
| _r | a data point collected from the renderer process |
| vm_ | virtual memory used |
| ws_ | working-set memory used |
| _peak_ | peak memory usage during the entire test |
| _final_ | memory usage when the test ended |
| _op_ | I/O operations |
| _byte_ | I/O bytes |
| read_ | I/O ops or bytes read |
| write_ | I/O ops or bytes written |
| other_ | any other I/O bytes or ops |
| total_ | sum of read, write, and other I/O |
So for example, "vm_final_b" is the final VM usage of the browser process.
Depending on the graph you're looking at, there will be one or more colored lines, or "traces". Generally one of these is the main data point for the build being tested ("t" for times, for instance) and one is data taken from a reference build so we can discount temporary glitches on the machine ("t_ref" for reference times). Other traces might be shown, too, and described in the legend below the plot.
If you click your mouse on the plot, one build will be highlighted by a grey vertical line, and the svn log for the build you've selected will be shown in a frame below the plot. Below the legend is the revision number and first data point (using the order on the legend) for that revision. It's followed by the data value for the spot your mouse is hovering over, so you can quickly compare two points. If you shift-click on the plot, you'll place a horizontal marker, and the offset between that marker and the mouse is shown in the lower right.
Adding a new performance plot
When a Chromium developer wants to measure a new aspect of Chromium's performance, the developer either modifies an already-in-place harness to provide additional data or creates a new harness to produce this data. When a new harness is added, the Chromium buildbot's configuration is updated to run it and told where to gather its performance test results. Modifying a harness to add more data may not require any buildbot configuration changes.
Tests in Chromium typically use one of the methods in chrome/test/perf/perf_test.h to print their results in the standard format expected by the post-processing scripts.
Monitoring performance for regressions
Once the Chromium buildbot runs all of a build's tests, it gathers the results on the perf dashboard and reports whether the test met, exceeded, or missed its expectations. The Chromium buildbot follows this algorithm to determine what to report after gathering results:
-
If the current test crashes or times out: -> FAILURE
-
If the current report being scanned doesn't match any trace instances (see "Format of expectations file" below) the buildbot is monitoring: -> SUCCESS
-
If any monitored trace instance regressed: -> FAILURE
-
If any monitored trace instance was faster than expected: -> WARNING
-
If all monitored trace instances were within expectations: -> SUCCESS
In a non-success result, the build's details are updated to include a description of which graph+trace regressed or got faster.
Format of expectations file
Perf regression monitoring is controlled via src/tools/perf_expectations/perf_expectations.json. This is a JSON file with the following format: { "PERFID/TEST/GRAPH/TRACE": {"reva": REVA, "revb": REVB, "improve": IMPROVE, "regress": REGRESS}, "PERFID/TEST/GRAPH/TRACE": {"reva": REVA, "revb": REVB, "improve": IMPROVE, "regress": REGRESS}, "PERFID/TEST/GRAPH/TRACE": {"reva": REVA, "revb": REVB, "improve": IMPROVE, "regress": REGRESS}, ..., "load": true }
| Name | Type | Description |
| PERFID | string | System perf name (ie. xp-release-dual-core -- see factory/chromium_commands.py). |
| TEST | string | Test name (ie. moz, startup -- see factory/chromium_commands.py). |
| GRAPH | string | Graph name (ie. times, warm). |
| TRACE | string | Trace name on the selected graph (ie. t, vm_rss_f_r). |
| REVA | integer | Start (inclusive) of expected range (see make_expectations.py). |
| REVB | integer | End (inclusive) of expected range (see make_expectations.py). |
| IMPROVE | integer | The best result of the current trace less the ref trace. In times tests, this is the lower value; in scores tests, the higher value. |
| REGRESS | integer | The worst allowed result of the current trace less the ref trace. In times tests, this is the higher value; in scores tests, the lower value. |
- Setting "load" to "true" enables performance regression monitoring.
- Strings must be quoted with " (not ').
- Comments are not allowed in JSON.
Perf expectations example
Take the following perf_expectations.json file as an example: {"xp-release-dual-core/morejs/times/t": {"improve": 50, "regress": 110}, "xp-release-dual-core/startup/warm/t": {"improve": -65, "regress": 25}, "load": true } This declares 2 trace instances that should be monitored for regressions, both on Chromium's XP perf test system. The first -- xp-release-dual-core/morejs/times/t -- monitors results of the morejs page cycler's page load time. It alerts when the page load time for the current build less the reference build is greater than 110ms.
The second -- xp-release-dual-core/startup/warm/t -- monitors results of the warm startup test and alerts when the difference between the current build and reference build is greater than 25ms. For each of these traces, warnings (not failures) are generated when speed ups occur. A speed up occurs when a given result is better than the expected improve value.
Updating performance expectations, selecting acceptable results, ...
See the Perf Sheriffing page for more details about updating perf expectations, selecting acceptable results, etc.