GWP-ASan: Sampling heap memory error detection in-the-wild
By Vlad Tsyrklevich, Dynamic Tools Teams — November 2019
Memory safety errors, like use-after-frees and out-of-bounds reads/writes, are a leading source of vulnerabilities in C/C++ applications. Despite investments in preventing and detecting these errors in Chrome, over 60% of high severity vulnerabilities in Chrome are memory safety errors. Some memory safety errors don’t lead to security vulnerabilities but simply cause crashes and instability.
Chrome uses state-of-the-art techniques to prevent these errors, including:
[Coverage-guided](https://llvm.org/docs/LibFuzzer.html)
[fuzzing](https://en.wikipedia.org/wiki/American_fuzzy_lop_(fuzzer)) with
[AddressSanitizer](https://clang.llvm.org/docs/AddressSanitizer.html) (ASan)

Unit and integration testing with ASan

Defensive programming, like custom libraries to perform safe math or provide
bounds checked containers

Mandatory code review
Chrome also makes use of sandboxing and exploit mitigations to complicate exploitation of memory errors that go undetected by the methods above.
AddressSanitizer is a compiler instrumentation that finds memory errors occurring on the heap, stack, or in globals. ASan is highly effective and one of the lowest overhead instrumentations available that detects the errors that it does; however, it still incurs an average 2-3x performance and memory overhead. This makes it suitable for use with unit tests or fuzzing, but not deployment to end users. Chrome used to deploy SyzyASAN instrumented binaries to detect memory errors. SyzyASAN had a similar overhead so it was only deployed to a small subset of users on the canary channel. It was discontinued after the Windows toolchain switched to LLVM.
GWP-ASan, also known by its recursive backronym, GWP-ASan Will Provide Allocation Sanity, is a sampling allocation tool designed to detect heap memory errors occurring in production with negligible overhead. Because of its negligible overhead we can deploy GWP-ASan to the entire Chrome user base to find memory errors happening in the real world that are not caught by fuzzing or testing with ASan. Unlike ASan, GWP-ASan can not find memory errors on the stack or in globals.
GWP-ASan is currently enabled for all Windows and macOS users for allocations made using malloc() and PartitionAlloc. It is only enabled for a small fraction of allocations and processes to reduce performance and memory overhead to a negligible amount. At the time of writing it has found over sixty bugs (many are still restricted view). About 90% of the issues GWP-ASan has found are use-after-frees. The remaining are out-of-bounds reads and writes.
Design
Overview
GWP-ASan is conceptually similar to ElectricFence or PageHeap. GWP-ASan installs an allocator instrumentation that samples allocations to a debug allocator that places allocations on their own page, buttressed on both sides by guard pages. New allocations are randomly either left- or right-aligned within the page so that accessing the allocation below or above its bounds causes a crash. When the allocation is freed, the page is unmapped so that a use-after-free also immediately crashes. The allocator limits itself to a fixed amount of memory to control memory overhead and samples allocation to the debug allocator to reduce its high performance overhead.
Use-after-frees and out-of-bounds accesses are often hard to debug because they corrupt unrelated memory which can lead to crashes in unrelated code. GWP-ASan simplifies debugging by causing a crash immediately at the site of the invalid memory access. Furthermore, when a crash occurs a special crash handler hook reports additional information, like allocation and deallocation stack traces, to aid debugging. This metadata is similar to what AddressSanitizer provides and has been shown to be very useful in identifying and fixing memory errors.
GWP-ASan is a heap-only instrumentation so it does not find memory errors on the stack or in globals that AddressSanitizer would; however, it can find some memory errors that ASan would not. ASan works by instrumenting memory accesses during compilation and makes use of ‘interceptors’ to detect misuse of common library functions. Because GWP-ASan uses native memory management to detect memory errors it doesn’t require interceptors to detect invalid memory use in system libraries. This means it can identify API misuse for uncommon APIs that don’t have interceptors, or even detect memory errors that occur due to bugs in system libraries—something ASan can’t do without recompiling those potentially proprietary libraries.
GWP-ASan is only as effective as the number of allocation call sites it instruments. For an internal Chrome allocator like PartitionAlloc it is possible to intercept all uses; however, for malloc/free we may only be able to instrument a subset of allocations. For example, on Windows we instrument malloc and free by overriding the symbols for modules we build linked against //base, so some DLLs shipped with Chrome—let alone Windows system code—may not be instrumented. On macOS however the system allocator allows adding global hooks meaning we can (and do) detect memory errors from allocations originating in code we don’t control, like Apple system libraries.
Allocator
The GWP-ASan allocator reserves a fixed range of memory at initialization that it uses to service allocations to limit memory overhead. The memory range consists of pages intended to be used to return allocations, called slots, buttressed by guard pages as shown below.

Allocations are randomly left- or right-aligned to help detect both underflows and overflows. Like a traditional allocator, the GWP-ASan allocator always suitably aligns allocations for any object of that size. This means that right-aligned allocations are not always directly adjacent to the following guard page, so small out-of-bounds accesses may go undetected.

An array of allocation metadata is also maintained on the side to store stack traces and other metadata for individual slots.
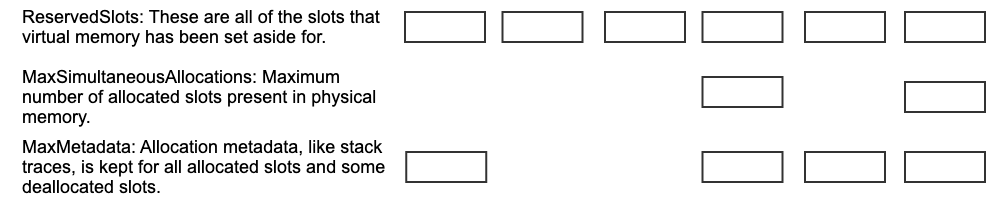
The allocator has three primary tunable parameters: MaxSimultaneousAllocations, MaxMetadata, and ReservedSlots. MaxSimultaneousAllocations controls the maximum number of allocations that can be simultaneously allocated.
Once every usable slot has been allocated and deallocated, they are reused to service new allocations. When a use-after-free occurs the use may not occur immediately after deallocation. If the slot has been reallocated then the use-after-free will not behave as expected. If the slot is still allocated then the use won’t crash, but if it is deallocated then it will cause a crash but the metadata for the slot will have the wrong allocation/deallocation stack traces.
Like ASan, GWP-ASan also makes use of a quarantine to help improve use-after-free detection. ReservedSlots is always greater than or equal to MaxSimultaneousAllocations and controls the number of slots we allocated virtual memory for. If ReservedSlots > MaxSimultaneousAllocations, then not all slots can be simultaneously allocated. If slots are allocated in a round-robin fashion then a slot will not be re-used until at least (ReservedSlots - MaxSimultaneousAllocations) allocations have taken place, forming a rudimentary quarantine. This delays the amount of time until a slot is re-used, improving use-after-free detection at the expense of using more memory. The allocator consumes more virtual memory for the additional quarantine slots and more physical memory storing allocation metadata about those quarantine slots. Each slot’s metadata consumes about 400 bytes, primarily to store compressed allocation/deallocation stack traces, compared to 4 kilobytes for every allocation. As a result, setting ReservedSlots to be slightly greater than MaxSimultaneousAllocations doesn’t significantly increase the amount of memory used.
The rudimentary quarantine described above is sufficient to delay slot re-use to accurately detect use-after-frees occurring shortly after deallocation; however, use-after-frees that occur long after deallocation are likely to access slots that have already been reallocated. This can lead to long-lived use-after-frees causing reports with numerous different stack traces for unrelated allocations and deallocations, making it difficult to identify the real allocation/deallocation call sites. This could be improved by making ReservedSlots orders of magnitude larger than MaxSimultaneousAllocations; however, the amount of additional allocation metadata that this would require allocating would significantly increase GWP-ASan’s memory profile.
To address this, GWP-ASan makes use of a third MaxMetadata parameter to limit the number of slots for which we store metadata. We tune the allocator such that ReservedSlots >= MaxMetadata >= MaxSimultaneousAllocations. GWP-ASan keeps metadata for all currently allocated slots as well as some previously deallocated slots. Because we discard metadata for some deallocated slots, we can not always report allocation metadata if those slots are accessed because of a use-after-free. By setting ReservedSlots to be an order of magnitude or more greater than MaxMetadata and MaxSimultaneousAllocations, we make the quarantine so large that many allocations have to occur before a slot is reused. This ensures that even long-lived use-after-frees are not likely to be reallocated before they’re accessed. If no metadata for the slot is available, then a useful report can’t be sent; however, we eliminate many false reports. Short-lived use-after-frees are still likely to be accessed before the metadata for the slot is eliminated. Using random eviction to purge old metadata entries allows metadata for old allocations to sometimes survive long enough to be reported for long-lived use-after-frees.
The debug allocator currently only services allocations less than or equal to a single page in size. This is not a fundamental limitation in the design--it’s possible to service larger allocations by increasing the size of a slot to be multiple pages. It simply hasn’t been addressed yet because allocations larger than a page are relatively rare.
Unactionable crash reports can occur when a pointer is corrupted and the overwritten value happens to accidentally point to a guard page or deallocated slot in the GWP-ASan region. When such a wild pointer is accessed, it causes a GWP-ASan report to be sent but it’s not actionable because the crash is caused by an unrelated bug that corrupted the pointer value to point to an unrelated allocation. In practice, such unactionable reports tend to occur on 32-bit devices because the address space is smaller and the probability of a wild pointer access touching the GWP-ASan region is much higher. GWP-ASan was disabled for 32-bit desktop builds in order to eliminate these unactionable reports. The allocator also explicitly maps the GWP-ASan memory region in high memory locations to avoid the operating system choosing to place GWP-ASan region in the bottom 32-bits of memory on 64-bit devices.
Allocator Hooks
GWP-ASan instruments an allocator’s allocation and deallocation routines. The allocation instrumentation performs sampling to only route a fraction of allocation requests to the debug allocator. The deallocation instrumentation determines if the given allocation was allocated by the debug allocator and routes the request to the debug allocator if so. Determining if an allocation was returned by GWP-ASan is as simple as checking that the address is in GWP-ASan’s fixed memory region and matching the address to the slot’s allocation metadata.
Production allocators are normally highly optimized so adding additional instrumentation to the allocation/deallocation hot paths can easily introduce significant performance regressions. While the debug allocator’s overhead can be reduced to an arbitrary amount by adjusting the sampling probability, the overhead of the instrumentation itself introduces a constant overhead. Some allocation-heavy microbenchmarks regressed up to 5% when introducing allocator instrumentation no matter how low the sampling probability was made.
The instrumentation regression stems from the allocator hot-paths being very performance sensitive and that instrumenting those hot-paths in Chrome requires introducing a costly indirect call. GWP-ASan uses process sampling, only enabling instrumentation for a fraction of processes, to reduce the instrumentation overhead. This allows reducing the instrumentation overhead arbitrarily and using more memory per-enabled process.
Crash Handler
Chrome is migrating to using crashpad for crash handling. Unlike its predecessor breakpad, crashpad works almost entirely out-of-process. GWP-ASan registers a hook in the crashpad process to inspect crashing processes in order to determine if the crashes are related to GWP-ASan. On initialization, GWP-ASan saves the address of the internal allocator object in a crashpad annotation so that the crash handler can access it in the event of a crash. If the crashpad hook finds this annotation, it reads the GWP-ASan allocator information to determine if the crash occurred due to an access to a GWP-ASan allocation. If so, it attaches metadata for the associated allocation to the crash report.
Tuning
Chrome uses a multi-process model with different types of processes with varying lifetimes and allocator demands. For example, there is a single browser process for the entire lifetime of a given browser window while many renderer processes can be launched and destroyed in a single tab. A browser process could be active for weeks and make tens of billions of allocations while other processes may live for milliseconds and make thousands of allocations. Accommodating both types of processes is tricky because there is a tension between GWP-ASan regularly sampling allocations and exhausting its fixed supply of memory.
GWP-ASan exhausts its memory when all MaxSimultaneousAllocations slots are taken and new allocations can’t be serviced. This can occur when all of the allocations are long-lived, e.g. freed long after allocation or never freed at all. If GWP-ASan runs out of allocations early in a process’ lifetime then the majority of the process’ allocations go unsampled.
In order to better understand allocation behavior we analyze heap traces for different runs of Chromium. The following trace comes from opening a browser, playing a YouTube video for ten seconds, and then closing the browser. The following visualization shows allocation lifetimes for malloc() allocations in the GPU process.

Every vertical bar represents two thousand allocations subdivided into different allocation lifetimes. The horizontal axis is the process lifetime. This process makes approximately 250,000 allocations. Most allocations are freed within 25 milliseconds, and only 4% of allocations are never freed during the process’ lifetime.
The following graph is for allocations made using PartitionAlloc in the YouTube renderer process:

This process makes about 1.1 million allocations and about 7% go unfreed. In both examples, unfreed allocations cluster at the beginning of the process’ lifetime. Because of the difference in number of total and long-lived allocations, the renderer process may exhaust GWP-ASan allocations early with the same parameters that would sample the GPU process without exhaustion.
Long lifetime allocations can also lead to temporary allocator exhaustion, for example if the allocations are not freed until right before process destruction. Modeling simulated runs with different GWP-ASan configurations over different heap traces best illustrates what allocator behavior can occur in practice. The following is a simulated run for the renderer trace above with sampling probability 1/1000 and 16 simultaneous allocations:

The bars represent allocation lifetimes, with the vertical axis being time. In the simulation above GWP-ASan runs out of allocations for most of the process lifetime with occasional bursts of sampling as long-lived allocations are freed and re-used until they are replaced by new long-lived allocations.
To avoid allocator exhaustion, the allocator must use more memory per process or reduce the sampling probability. The following is a simulation run with sampling probability 1/8000 and 64 simultaneous allocations:

In this simulation GWP-ASan is able to evenly sample the entire process’ lifetime despite the presence of long-lived and unfreed allocations. Some runs may still be unlucky and run out of allocations early, but it’s far less common.
In practice, because of process sampling we can allocate more memory per enabled process. GWP-ASan’s production settings only sample a small fraction of processes, so it’s safe to allocate more memory for every enabled process.
Instead of uniformly reducing the sampling probability for all processes, GWP-ASan picks a sampling probability from a range of probabilities at initialization. The sampling probability may sometimes be more frequent (and lead to early allocator exhaustion), or less frequent (and lead to fewer detected errors), than optimal. However, it allows accommodating different allocation behavior in different processes.
Results
The Chrome project makes extensive use of ASan in unit tests and during fuzzing with ClusterFuzz to detect memory errors early. As a result, the bugs GWP-ASan finds tend to be where our current fuzzing and test infrastructure don't sufficiently test the underlying error conditions. Unit and integration tests typically tend to only test expected success and failure conditions. Fuzzers test a wider variety of inputs, but coverage isn’t universal. Furthermore, fuzzing is well suited for testing specific narrowly-scoped components like parsers and other input processors, but not all memory safety errors in Chrome fit that description.
Some of the types of bugs that GWP-ASan has been successful in finding include:
Race conditions. These may manifest as races between two threads freeing an
allocation and using it, or an event firing at an inopportune time such that
an allocation used by the parent event loop is freed by the event.
ClusterFuzz may not be able to exercise the correct conditions to trigger
the race or may not reproduce the racy crash reliably enough to satisfy a
heuristic to avoid reporting false positives.

Chrome- or OS-specific configuration bugs. Some bugs may only manifest in
configurations that are not exercised by Chrome’s testing and fuzzing
infrastructure.

Bugs in UI code. Unit tests and fuzzers tend not to exercise UI code. UI
code is also susceptible to lifetime and bounds-related errors though they
are more likely to be stability issues instead of security issues.
One example issue is this bug in Skia. The underlying memory error is a racy use-after-free where two threads near-simultaneously free and access an allocation. This bug had been causing crashes on macOS for a while, but it was difficult to spot the issue because the crashes occurred in different places depending on which underlying allocation was corrupted. With GWP-ASan it was immediately clear where the error occurred, but both threads freeing and accessing the allocation were doing so after locking the same mutex so it should have been impossible. With the use and deallocation stack traces proving that this was occurring despite the mutex, it was easy to track the bug down to the Skia mutex class. The macOS implementation did not account for spurious wake-ups and could violate mutual exclusion. Without the information provided by GWP-ASan, it would be difficult to debug such an issue.
As GWP-ASan was progressively rolled out to wider audiences, it detected rarer and rarer bugs. Frequently occurring bugs may be detected within hours of a new canary release while some rarely-occurring bugs have only been detected in the stable population once so far. It’s possible to find these rare errors because GWP-ASan is deployed widely and designed to minimize unactionable reports, but there are likely to be rare errors that we don’t catch because increasing sampling to detect them would require unacceptable memory and performance overhead. The ARM Memory Tagging Extension and similar hardware-assisted memory tagging schemes would allow implementing a similar error detector with much lower memory and performance overhead and a much higher probability of detecting errors. Such memory tagging schemes also allow detecting stack bounds and use-after-return errors and may even be useful as exploit mitigations.
Future Improvements
GWP-ASan has a high memory overhead per allocation. Every allocation is stored on its own page but Chrome’s median allocation size is only 32 bytes. It’s possible to place multiple allocations on a single physical page and maintain the ability to detect use-after-frees using a special virtual memory configuration. The approach reduces GWP-ASan’s memory overhead at the cost of reducing out-of-bounds error detection.
Placing multiple allocations on the same virtual memory page would reduce use-after-free detection because the page could not be unmapped until all of the allocations on the page were deallocated. If a single allocation on that page were to never be freed then use-after-free detection would be completely lost.
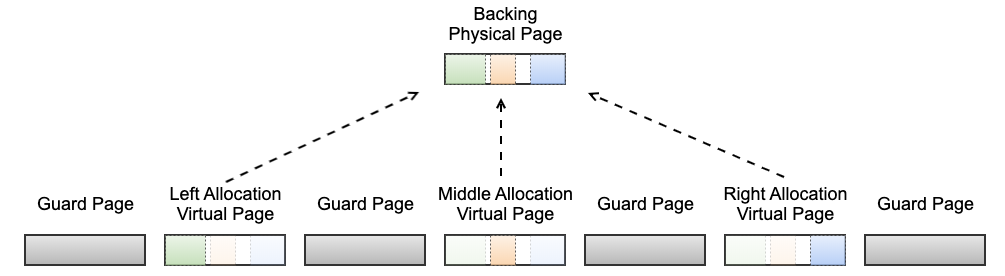
It is possible to use the operating system’s shared memory facilities to work around this constraint. It is possible to map shared memory multiple times in the same process. This allows multiple virtual memory pages to point to the same backing physical page. Multiple allocations can be placed on the same backing physical page but every allocation can be given it’s own unique slot/virtual page. This way, once an allocation is freed, the slot can be unmapped to detect use-after-frees without interfering with the other allocations. Only a fraction of allocations will be able to be left- or right-aligned within the page so out-of-bounds errors detection would suffer with this scheme; however, in practice use-after-free exceptions are much more common.
This approach allows significantly increasing memory density and therefore the number of simultaneous allocations. It’s conceivable that the memory overhead of allocation metadata like stack traces would come to dominate GWP-ASan’s memory usage instead of the wasted page overhead.
Increasing the number of simultaneous allocations helps prevent allocator exhaustion. Mobile platforms especially tend to be much more memory constrained so deploying GWP-ASan in those environments may necessitate use of this approach.
Thanks to Matthew Denton, Adrian Taylor, Chris Palmer, Kostya Serebryany, Matt Morehouse, and Mitch Phillips for their feedback.