Service Worker Debugging
Q: How do I debug?
A: From a page on the same origin, go to Developer Tools > Application > Service Workers.
You can also use chrome://inspect/#service-workers to find all running service workers.
To poke around at the internals (usually only Chromium developers should need this), visit chrome://serviceworker-internals .
Q: When I have Developer Tools open, requests go straight to the network; the Service Worker does not get a fetch event.
A: On the Developer Tools' Network tab, if Disable cache is checked, requests will go to the network instead of the Service Worker. Uncheck that.
Q: I get an error message about "Only secure origins are allowed". Why?
A: Service workers are only available to "secure origins" (HTTPS sites, basically) in line with a policy to prefer secure origins for powerful new features. However http://localhost is also considered a secure origin, so if you can, developing on localhost is an easy way to avoid this error.
You can also use the --unsafely-treat-insecure-origin-as-secure command-line flag to explicitly list a HTTP Origin. For example:
$ ./chrome --unsafely-treat-insecure-origin-as-secure=http://your.insecure.site:8080
(Prior to Chrome 62, you must also include the --user-data-dir=/test/only/profile/dir to create a fresh testing profile for the unsafely-treat-insecure-origin-as-secure flag to work.)
If you want to test on https://localhost with a self-signed certificate, do:
$ ./chrome --allow-insecure-localhost https://localhost
You might also find the --ignore-certificate-errors flag useful.
Q: I made a change to my service worker. How do I reload?
A: From Developer Tools > Application > Service Workers, check "Update on reload" and reload the page.
Q: I have a different question.
A: Reach us out via service-worker-discuss or Stack Overflow with "service-worker" hash tag.
Experimental Service Worker Debugging functionality
Step-wise SW debugging
Chrome 44 required, but no experiments needed. Debugging message flow using conventional breakpoint debugging on both ends (page and the sw). You can kill the worker to debug its installation, you can debug the way it serves resources, etc.
Active SW in Sources
- Navigate to a page w/ service worker, opens DevTools
- Worker is displayed in the Threads list
- Service Workers tab lists Active Running service workers this page (its iframes) belong to

Console execution
- Console displays contexts for frames as well as workers
- One can execute expressions in the SW context and filter by context


Console errors
- Should there be any installation errors (syntax errors in main script), they are available in the page console
- Clicking on the error message reveals the erroneous script

Breakpoints
- User can set breakpoints in the service worker scripts
- Should user set the breakpoint, Stop the service worker and reload the page, service worker will stop on that breakpoint

SW debugging panel in Resources
- Turn on DevTools experiments (in
about:flags) - In DevTools, Go to Settings -> Experiments, hit Shift 6 times
- Check "Service worker inspection", close and reopen DevTools
- Now you have this experiment enabled.
This experiment unlocks a view in Resources just like you asked.
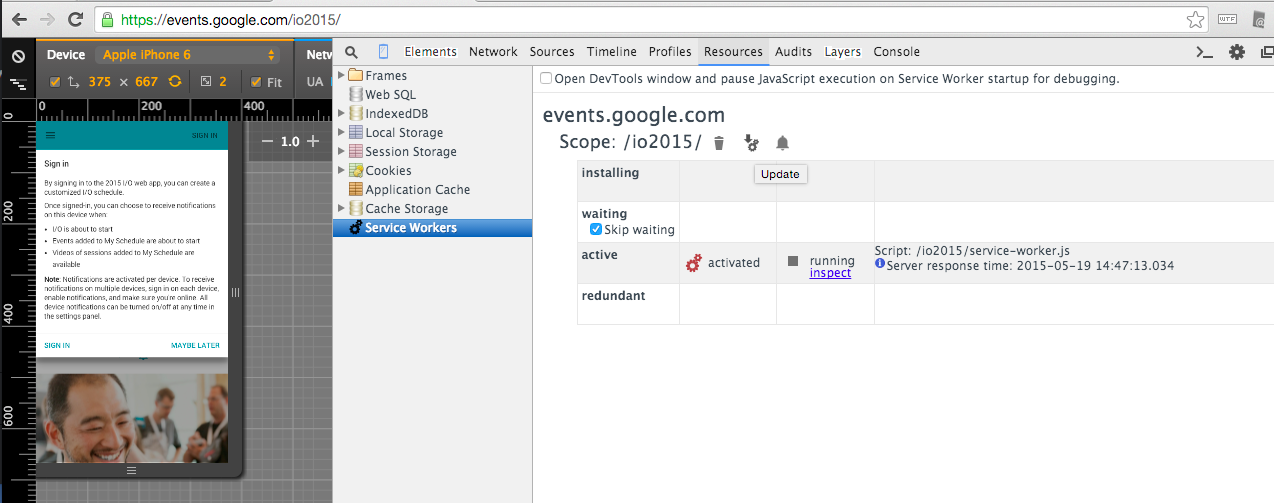 Currently, to view network activity of the worker, click the "inspect" from
Resources to launch a dedicated devtools window for the worker itself.
Currently, to view network activity of the worker, click the "inspect" from
Resources to launch a dedicated devtools window for the worker itself.