
Power consumption & Finch experimentation
Overview
CrOS has defined Guardrail metrics which track critical areas of product health, such as Daily Active Users and crash count. A lesser known Guardrail metric which is often applicable for our team's features is Power.BatteryDischargeRate, otherwise known as power consumption or battery life. When a Finch-controlled feature launch rolls out, we'll receive Chirp alerts if there is an effect on any Core or Guardrail metrics (including power consumption). If you suspect your feature will have an effect on OS performance, it's recommended to follow the procedure below.
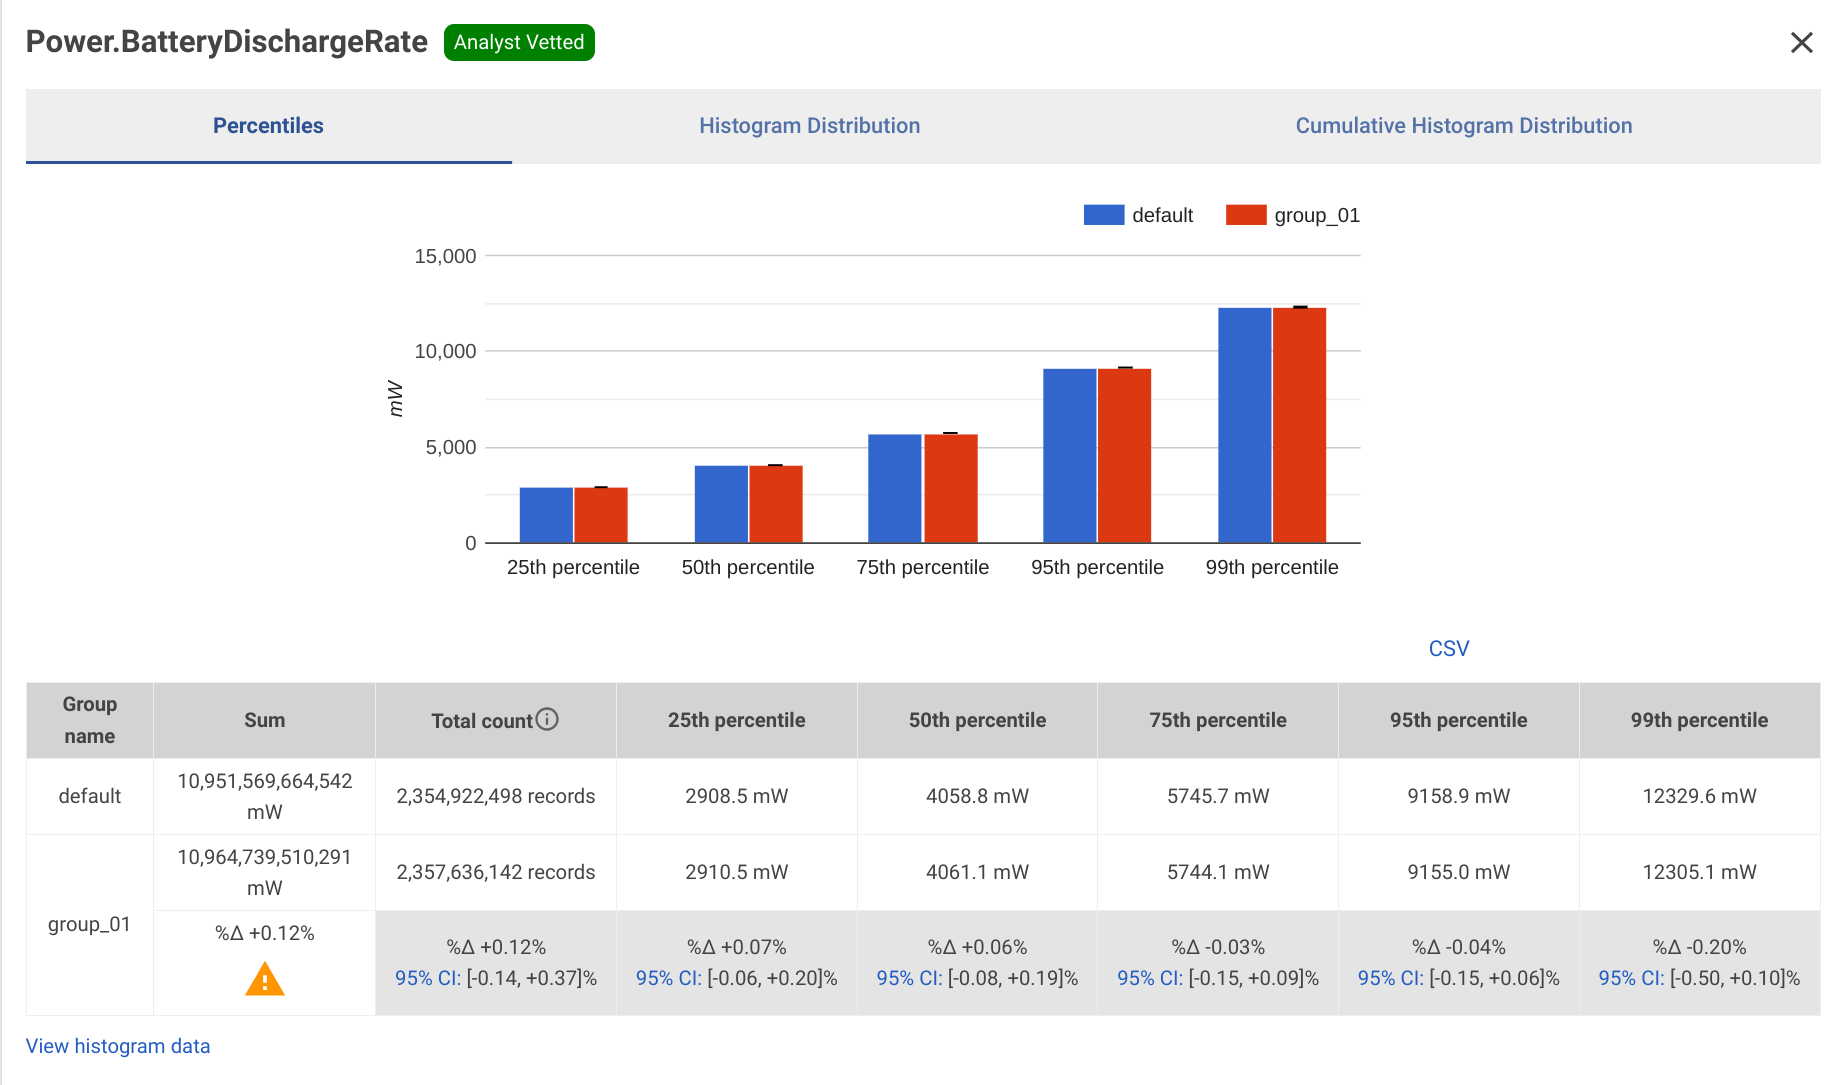
Figure 1: The UMA Power Consumption histogram for a Finch experiment.
Feature launches and A/
Experimentation Plan
The
ChromeOS Data team
provides support for ChromeOS developers who want A/
- Make a copy of go/
cros-exp-launch-report , and fill out the Pre-Consultation section. - Optional: Set up an Office Hours appointment with a Data team analyst.
- Set up the Finch experiment and analyze the results with your analyst as the experiment progresses.
References
- Fast Pair Power Consumption analysis doc
- Quick Share Background Scanning Power Consumption analysis doc
Setting up the Finch experiment
Read through go/
There are several steps common to all Finch launches, which can be found at
go/
- Implement the feature behind a new
DISABLED_BY_DEFAULTbase::Feature flag. - Create a new Finch
config
for the experiment. The new feature will be
enabledin half the population, anddisabledin the other half of the population (hence an A/B experiment). - Create a field trial testing config for experiments that plan to go to Beta or Stable.
- Slowly rollout the experiment on Canary, Dev, Beta, and then Stable. It is recommended to have a very fine grained Stable rollout, such as from 1% Stable to 10% Stable to 50% Stable, rather than the usual 1% to 100% Stable used in Finch-controlled feature launches.
Tip: g/
For power consumption, you want one of the key histograms evaluating performance
to be 'Power.BatteryDischargeRate'. You can optionally add other key
histograms if you're trying run another A/
References
- Fast Pair Power Consumption GCL #1 (Canary and Dev)
- Fast Pair Power Consumption GCL #2 (Canary, Dev, and Beta)
- Fast Pair Power Consumption GCL #3 (Canary, Dev, Beta, and 1% Stable)
- Fast Pair Power Consumption GCL #4 (Canary, Dev, Beta, and 10% Stable)
- Fast Pair Power Consumption GCL #5 (Canary, Dev, Beta, and 50% Stable)
- Fast Pair Power Consumption GCL #6 (launched)
- Quick Share Background Scanning Power Consumption GCL
Evaluating experiments with UMA
You should keep a close watch on your experiment's metrics, especially with how it affects ChromeOS Guardrail metrics, including power consumption. This is done using UMA's "Finch" tab. These metrics should be evaluated before every stage of the experiment rollout. If you're unsure of what to make of the metrics, reach out to your advisor at cros-exp-help@google.com.
Example: Fast Pair power consumption A/B study
Here's a snapshot of our Fast Pair power consumption A/
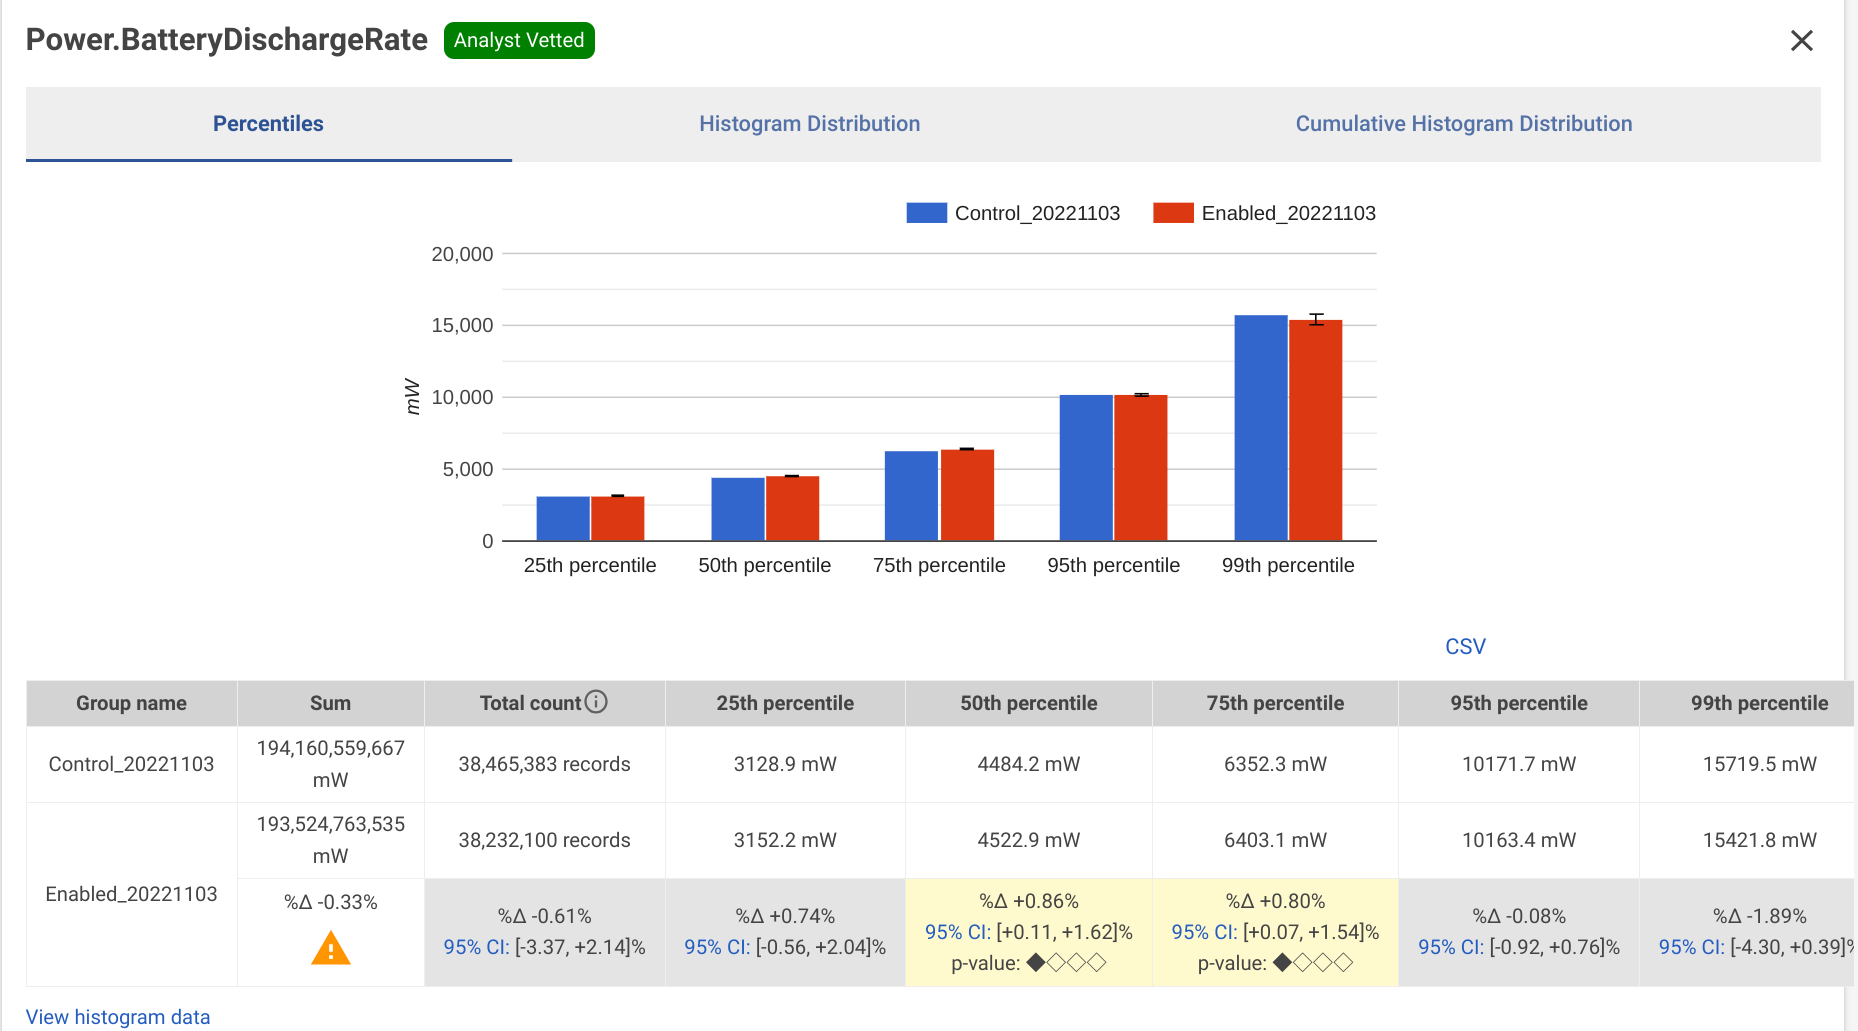
Figure 2: The UMA Power Consumption histogram for Fast Pair on Dec 27, 2022.
There's a couple of things to notice in this histogram:
- The power consumption increased by about ~0.8%, which was within the bounds set in our launch criteria (3.3% or less).
- The p-value of our "increase" is very low (gray signifies weak confidence, and 2+ diamonds indicate some confidence). In general, the higher the p-value, the higher confidence you have that your experiment is having an effect on your chosen metric.
- The confidence interval (CI) at the 50th percentile was "95% CI [+0.11, +1.62]%". A narrower CI (like this one with a range of 1.51%) provides more confidence in the value of the median delta (+0.86%).
- Since the percent impact on power consumption was within bounds and our confidence was low, our analyst agreed with our decision to increase the rollout to 1% stable. Larger populations generally increase the p-value and confidence in experiments, if a correlation exists.
Note: You can consult the analyst at any point of the rollout to go over these histograms. You must consult the analyst before ramping up to Beta and Stable channel.
Clean-up
As mentioned earlier, the example studies used in this document are launched features, so the end result is the same as a Finch feature rollout. Specifically, that means we did the following after evaluating the last Stable experiment group:
- Enable the feature by default on ToT
- Modify the GCL config to be LAUNCHED, with the max version being the last version that had your feature flag disabled by default.
Alternatively, your A/
Notes
For Fast Pair and Quick Share Background Scanning, having a Finch experiment helped us confirm our hypothesis (and launch criteria) that there was not a large effect on the battery life. This allowed us to make data-driven decisions about going to launch.
In addition to an A/