Debugging Chromium on Windows
First see get the code for checkout and build instructions.
Getting started
You can use Visual Studio's built-in debugger or WinDBG to debug Chromium. You don't need to use the IDE to build in order to use the debugger: autoninja is used to build Chromium and most developers invoke it from a command prompt, and then open the IDE for debugging as necessary. To start debugging an already-built executable with Visual Studio just launch Visual Studio (2019 or higher) and select File-> Open-> Project/Solution (Ctrl+Shift+O) and select the executable of interest. This will create a solution with that executable as the 'project'. You can then launch the debugger with F5 or F11 or from the Debug menu. If you right-click on the executable in Solution Explorer and select properties then you can edit things such as the executable path, command-line arguments, and working directory.
You can add additional executables to the solution by using File-> Add-> Existing Project and selecting another already-built executable. You can select which one to debug by right-clicking on one of them in Solution Explorer and selecting Set as Startup Project.
When your solution file is customized to your taste you can save it to a directory such as out\solutions. Saving it there helps ensure that relative paths to source files, printed from build commands, will correctly identify the source files.
The Tools menu can be used to add commands to do things like invoke autoninja to build Chrome, compile the selected source file, or other things.
Visual Studio 2017 is not recommended for debugging of Chromium - use a newer version for best performance and stability.
symbol_level=2 is the default on Windows and gives full debugging information
with types, locals, globals, function names, and source/line information.
symbol_level=1 creates smaller PDBs with just function names, and source/line
information - source-level debugging is still supported (new from June 2019),
but local variables and type information are missing. symbol_level=0 gives
extremely limited debugging abilities, mostly just viewing call stacks when
Chromium crashes.
Browsing source code
If you use a solution file generated by gn (gn gen --ide=vs) then Intellisense
may help you navigate the code. If this doesn't work or if you use a solution
created as above then you may want to install
VsChromium to help navigate the code,
as well as using https://source.chromium.org.
Profiles
It's a good idea to use a different Chrome profile for your debugging. If you are debugging Google Chrome branded builds, or use a Chromium build as your primary browser, the profiles can collide so you can't run both at once, and your stable browser might see profile versions from the future (Google Chrome and Chromium use different profile directories by default so won't collide). Use the command-line option:
--user-data-dir=C:\tmp\my_debug_profile (replace the path as necessary)
Using the IDE, go to the Debugging tab of the properties of the chrome project, and set the Command Arguments.
Chrome debug log
Enable Chrome debug logging to a file by passing --enable-logging --v=1
command-line flags at startup. Debug builds place the chrome_debug.log file in
the out\Debug directory. Release builds place the file in the top level of the
user data Chromium app directory, which is OS-version-dependent. For more
information, see logging and user data
directory details.
Symbol server
If you are debugging official Google Chrome release builds, use the symbol server:
https://chromium-browser-symsrv.commondatastorage.googleapis.com
In Visual Studio, this goes in Tools > Options under Debugging > Symbols. You should set up a local cache in a empty directory on your computer.
In windbg you can add this to your symbol server search path with the command below, where C:\symbols is a local cache directory:
.sympath+ SRV\*C:\symbols\*https://chromium-browser-symsrv.commondatastorage.googleapis.com
Alternately, You can set the _NT_SYMBOL_PATH environment variable to include both the Microsoft and Google symbol servers - VS, windbg, and other tools should both respect this environment variable:
_NT_SYMBOL_PATH=SRV\*C:\symbols\*https://msdl.microsoft.com/download/symbols;SRV\*C:\symbols\*https://chromium-browser-symsrv.commondatastorage.googleapis.com
Note that symbol servers will let the debuggers download both the PE files (DLLs and EXEs) and the PDB files.
Chrome often loads third party libraries and partial symbols for some of these are also public. For example:
AMD: https://download.amd.com/dir/bin
Nvidia: https://driver-symbols.nvidia.com/
Intel: https://software.intel.com/sites/downloads/symbols/
For example, for completeness, the following symbol server environment variable will resolve all of the above sources - but this is more than is normally needed:
_NT_SYMBOL_PATH=SRV\*C:\symbols\*https://msdl.microsoft.com/download/symbols;SRV\*C:\symbols\*https://chromium-browser-symsrv.commondatastorage.googleapis.com;SRV\*C:\symbols\*https://download.amd.com/dir/bin;SRV\*C:\symbols\*https://driver-symbols.nvidia.com/;SRV\*C:\symbols\*https://software.intel.com/sites/downloads/symbols/
Source indexing
You should set up source indexing in your debugger (.srcfix in windbg,
Tools-> Options-> Debugging-> General-> Enable source server
support in Visual Studio) so that the correct source files will automatically
be downloaded based on information in the downloaded symbols.
Additionally, you must have python in your path in order for the command that
fetches source
files
to succeed; launching the debugger from the same environment as where you build
Chromium is an easy way to ensure it's present.
This is highly recommended when debugging released Google Chrome builds or looking at crash dumps. Having the correct version of the source files automatically show up saves significant time so you should definitely set this.
Multi-process issues
Chromium can be challenging to debug because of its multi-process architecture. When you select Run in the debugger, only the main browser process will be debugged. The code that actually renders web pages (the Renderer) and the plugins will be in separate processes that's not (yet!) being debugged. The ProcessExplorer tool has a process tree view where you can see how these processes are related. You can also get the process IDs associated with each tab from the Chrome Task Manager (right-click on an empty area of the window title bar to open).
Automatically attach to child processes
There are two Visual Studio extensions that enable the debugger to automatically attach to all Chrome processes, so you can debug all of Chrome at once. Microsoft's Child Process Debugging Power Tool is a standalone extension for this, and VsChromium is another option that bundles many other additional features. In addition to installing one of these extensions, you must run Visual Studio as Administrator, or it will silently fail to attach to some of Chrome's child processes.
Single-process mode
One way to debug issues is to run Chromium in single-process mode. This will allow you to see the entire state of the program without extra work (although it will still have many threads). To use single-process mode, add the command-line flag
--single-process
This approach isn't perfect because some problems won't manifest themselves in this mode and some features don't work and worker threads are still spawned into new processes.
Manually attaching to a child process
You can attach to the running child processes with the debugger. Select Tools > Attach to Process and click the chrome.exe process you want to attach to. Before attaching, make sure you have selected only Native code when attaching to the process This is done by clicking Select... in the Attach to Process window and only checking Native. If you forget this, it may attempt to attach in "WebKit" mode to debug JavaScript, and you'll get an error message "An operation is not legal in the current state."
You can now debug the two processes as if they were one. When you are debugging multiple processes, open the Debug > Windows > Processes window to switch between them.
Sometimes you are debugging something that only happens on startup, and want to see the child process as soon as it starts. Use:
--renderer-startup-dialog --no-sandbox
You have to disable the sandbox or the dialog box will be prohibited from showing. When the dialog appears, visit Tools > Attach to Process and attach to the process showing the Renderer startup dialog. Now you're debugging in the renderer and can continue execution by pressing OK in the dialog.
Startup dialogs also exist for other child process types:
--gpu-startup-dialog, --ppapi-startup-dialog, --utility-startup-dialog,
--plugin-startup-dialog (for NPAPI).
For utilities, you can add a service type
--utility-startup-dialog=data_decoder.mojom.DataDecoderService.
You can also try the vs-chromium plug-in to attach to the right processes.
Semi-automatically attaching the debugger to child processes
The following flags cause child processes to wait for 60 seconds in a busy loop for a debugger to attach to the process. Once either condition is true, it continues on; no exception is thrown.
--wait-for-debugger-children[=filter]
The filter, if provided, will fire only if it matches the --type parameter
to the process. Values include renderer, plugin (for NPAPI), ppapi, gpu-process,
and utility.
When using this option, it may be helpful to limit the number of renderer processes spawned, using:
--renderer-process-limit=1
Image File Execution Options
Using Image File Execution Options (IFEO) will not work because CreateProcess() returns the handle to the debugger process instead of the intended child process. There are also issues with the sandbox.
Time travel debugging
You can do time travel debugging using WinDbg Preview (must be installed from the Microsoft Store). This lets you execute a program forward and backwards. After capturing a trace, you can set breakpoints and step through code as normal, but also provides 'backwards' commands (g-, t-, p-) so that you can go back and forth through the execution. It is especially useful to set data breakpoints (ba command) and reverse continuing, so you can see when a certain variable was last changed to its current value.
Chromium specifics:
-
The type of injection the time travel tracer needs to perform is incompatible with the Chromium sandbox. In order to record a trace, you'll need to run with
--no-sandbox. -
Chromium cannot run elevated with Administrator privileges, so the "Launch executable (advance)" option won't work, you'll need to attach after the process has already launched via the checkbox in the bottom right.
-
If you need to record startup-like things, you'll have to use --{browser,gpu,renderer,utility}-startup-dialog, then attach (and hope the relevant code hasn't executed before that point).
JsDbg -- data structure visualization
You can install JsDbg as a plugin for WinDbg or Visual Studio. It interactively lets you look at data structures (such as the DOM tree, Accessibility tree, layout object tree, and others) in a web browser as you debug. See the JsDbg site for some screen shots and usage examples. This also works when examining memory dumps (though not minidumps), and also works together with time travel debugging.
Visual Studio hints
Debug visualizers
Chrome's custom debug visualizers should be added to the pdb files and automatically picked up by Visual Studio. The definitions are in //tools/win/DebugVisualizers if you need to modify them (the BUILD.gn file there has additional instructions).
Don't step into trivial functions
The debugger can be configured to automatically not step into functions based on
regular expression. Edit default.natstepfilter in the following directory:
- For Visual Studio 2015:
C:\Program Files (x86)\Microsoft Visual Studio 14.0\Common7\Packages\Debugger\Visualizers(for all users) or%USERPROFILE%\My Documents\Visual Studio 2015\Visualizers(for the current user only) - For Visual Studio 2017 Pro:
C:\Program Files (x86)\Microsoft Visual Studio\2017\Professional\Common7\Packages\Debugger\Visualizers(for all users) or%USERPROFILE%\My Documents\Visual Studio 2017\Visualizers(for the current user only)
Add regular expressions of functions to not step into. Remember to regex-escape and XML-escape them, e.g. < for < and \. for a literal dot. Example:
<Function><Name>operator new</Name><Action>NoStepInto</Action></Function>
<Function><Name>operator delete</Name><Action>NoStepInto</Action></Function>
<!-- Skip everything in std -->
<Function><Name>std::.*</Name><Action>NoStepInto</Action></Function>
<!-- all methods on WebKit OwnPtr and variants, ... WTF::*Ptr<*>::* -->
<Function><Name>WTF::.*Ptr<.*>::.*</Name><Action>NoStepInto</Action></Function>
This file is read at start of a debugging session (F5), so you don't need to restart Visual Studio after changing it.
More info: Microsoft email thread
V8 and Chromium
V8 supports many command-line flags that are useful for debugging. V8 command-line flags can be set via the Chromium command-line flag --js-flags; for instance:
chrome.exe --js-flags="--trace_exception --heap_stats"
Note that some V8 command-line flags exist only in the debug build of V8. For a list of all V8 flags try:
chrome.exe --js-flags="--help"
Graphics debugging
GPU Acceleration of rendering can be more easily debugged with tools. See:
Debugging on another machine
Sometimes it's useful to debug installation and execution on a machine other than your primary build box. To run the installer on said other machine, first build the mini_installer target on your main build machine (e.g., autoninja -C out\Debug mini_installer). Next, on the debug machine:
- Make the build machine's build volume available on the debug machine either by mounting it locally (e.g., Z:\) or by crafting a UNC path to it (e.g., \\builder\src)
- Open up a command prompt and change to a local disk
- Run src\tools\win\copy-installer.bat in the remote checkout by way of the mount (e.g., Z:\PATHTOCHECKOUT\src\...) or UNC path (e.g., \\builder\src\...). This will copy the installer, DLLs, and PDBs into your debug machine's C:\out or C:\build (depending on if you're rocking the component=shared_library build or not)
- Run
C:\out\Debug\mini_installer.exewith the flags of your choice to install Chrome. This can take some time, especially on a slow machine. Watch the Task Manager and wait until mini_installer.exe exits before trying to launch Chrome (by way of the shortcut(s) created by the installer) - For extra pleasure, add C:\out\Debug to your _NT_SYMBOL_PATH environment variable
Consider reading the documentation at the top of copy-installer.bat to see how you can run it. It tries to be smart and copy the right things, but you may need to be explicit (e.g., "copy-installer.bat out Debug"). It is safe to re-run the script to copy only modified files (after a rebuild, for example).
You can also use the zip action of the isolate scripts (tools\mb\mb.py) to package all the files for a target into a single zip file, for example:
python tools\mb\mb.py zip out/Release base_unittests base_unittests.zip
Finding all memory allocations
It is possible to use Heap Snapshots to get call stacks on all outstanding allocations that use the OS heap. This works particularly well if heap snapshots are started as soon as the Chrome browser process is created, but before it starts running. Details can be found in this batch file. However, with PartitionAlloc Everywhere most Chromium allocations no longer use the Windows heap so this will only find a subset of allocations, mostly from OS DLLs.
Find memory leaks
Note: as with Heap Snapshots the utility of UMDH is greatly reduced now because PartitionAlloc Everywhere has mostly replaced the Windows heap.
The Windows heap manager has a really useful debug flag, where it can be asked to capture and store a stack trace with every allocation. The tool to scrape these stack traces out of processes is UMDH, which comes with WinDbg.
UMDH is great. It will capture a snapshot of the heap state as many times as you like, and it'll do it fairly quickly. You then run it again against either a single snapshot, or a pair of snapshots, at which time it'll symbolize the stack traces and aggregate usage up to unique stack traces.
Turning on the user stack trace database for chrome.exe with gflags.exe makes it run unbearably slowly; however, turning on the user stack trace database on for the browser alone is just fine.
While it's possible to turn on the user stack database with the "!gflag" debugging extension, it's too late to do this by the time the initial debugger breakpoint hits. The only reasonable way to do this is to
- Launch GFlags.exe,
- Enable the user stack trace database (per image below),
- Launch Chrome under the debugger.
- Set a breakpont when chrome.dll loads with "sxe ld chrome.dll".
- Step up, to allow Chrome.dll to initialize.
- Disable the stack trace database in GFlags.exe.
- Continue chrome, optionally detaching the debugger.
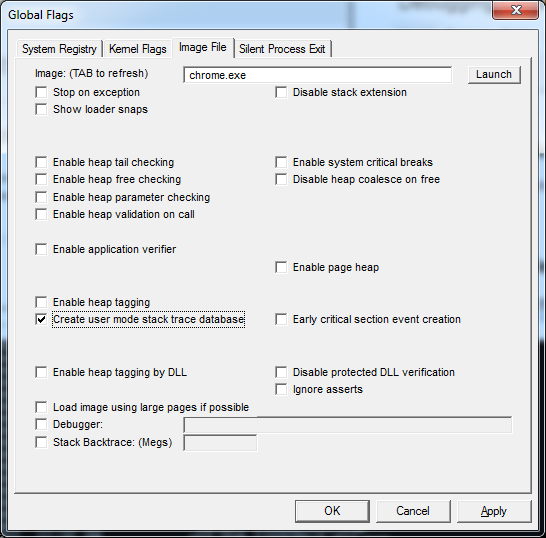
GFlags.exe settings for user mode stack trace database.
If you then ever suffer a browser memory leak, you can snarf a dump of the process with
umdh -p:<my browser pid> > chrome-browser-leak-umdh-dump.txt
which can then typically be "trivially" analyzed to find the culprit.
Miscellaneous
Note that by default Application Verifier only works with non-official builds of Chromium. To use Application Verifier on official builds you need to add --disable-features=RendererCodeIntegrity to avoid sandbox crashes in renderer processes. See crbug.com/1004989 for details. See also this page.
-
Application Verifier is a free tool from Microsoft (available as part of the Windows SDK) that can be used to flush out programming errors. Starting with M68 Application Verifier can be enabled for chrome.exe without needing to disable the sandbox. After adding chrome.exe to the list of applications to be stressed you need to expand the list of Basics checks and disable the Leak checks. You may also need to disable Handles and Locks checks depending on your graphics driver and specific Chrome version, but the eventual goal is to have Chrome run with Handles and Locks checks enabled. When bugs are found Chrome will trigger a breakpoint so running all Chrome processes under a debugger is recommended. Chrome will run much more slowly because Application Verifier puts every heap allocation on a separate page. Note that with PartitionAlloc Everywhere most Chromium allocations don't actually go through the Windows heap and are therefore unaffected by Application Verifier.
-
You can check the undocumented 'Cuzz' checkbox in Application Verifier to get the Windows thread scheduler to add some extra randomness in order to help expose race conditions in your code.
-
To put a breakpoint on CreateFile(), add this break point: {,,kernel32.dll}_CreateFileW@28
- {,,kernel32.dll} specifies the DLL (context operator).
- _ prefix means extern "C".
- @28 postfix means _stdcall with the stack pop at the end of the function. i.e. the number of arguments in BYTES.
-
You can use DebugView from SysInternals or sawbuck to view LOG() messages that normally go to stderr on POSIX.