The Trace Event Profiling Tool (about:tracing)
When diagnosing performance problems it can be valuable to see what Chrome is doing "under the hood." One way to get a more detailed view into what's going on is to use the about:tracing tool.
Tracing records activity in Chrome's processes (see multi-process architecture for more on what each process is doing). It records C++ or javascript method signatures in a hierarchical view for each thread in each process. This is a lot of information, but sifting through it can help identify performance bottlenecks, slow operations, and events with irregular lengths (leading to e.g. framerate variation).
Getting Started Using about:tracing
- Recording Tracing Runs; start with this, it's a prerequisite for using about:tracing.
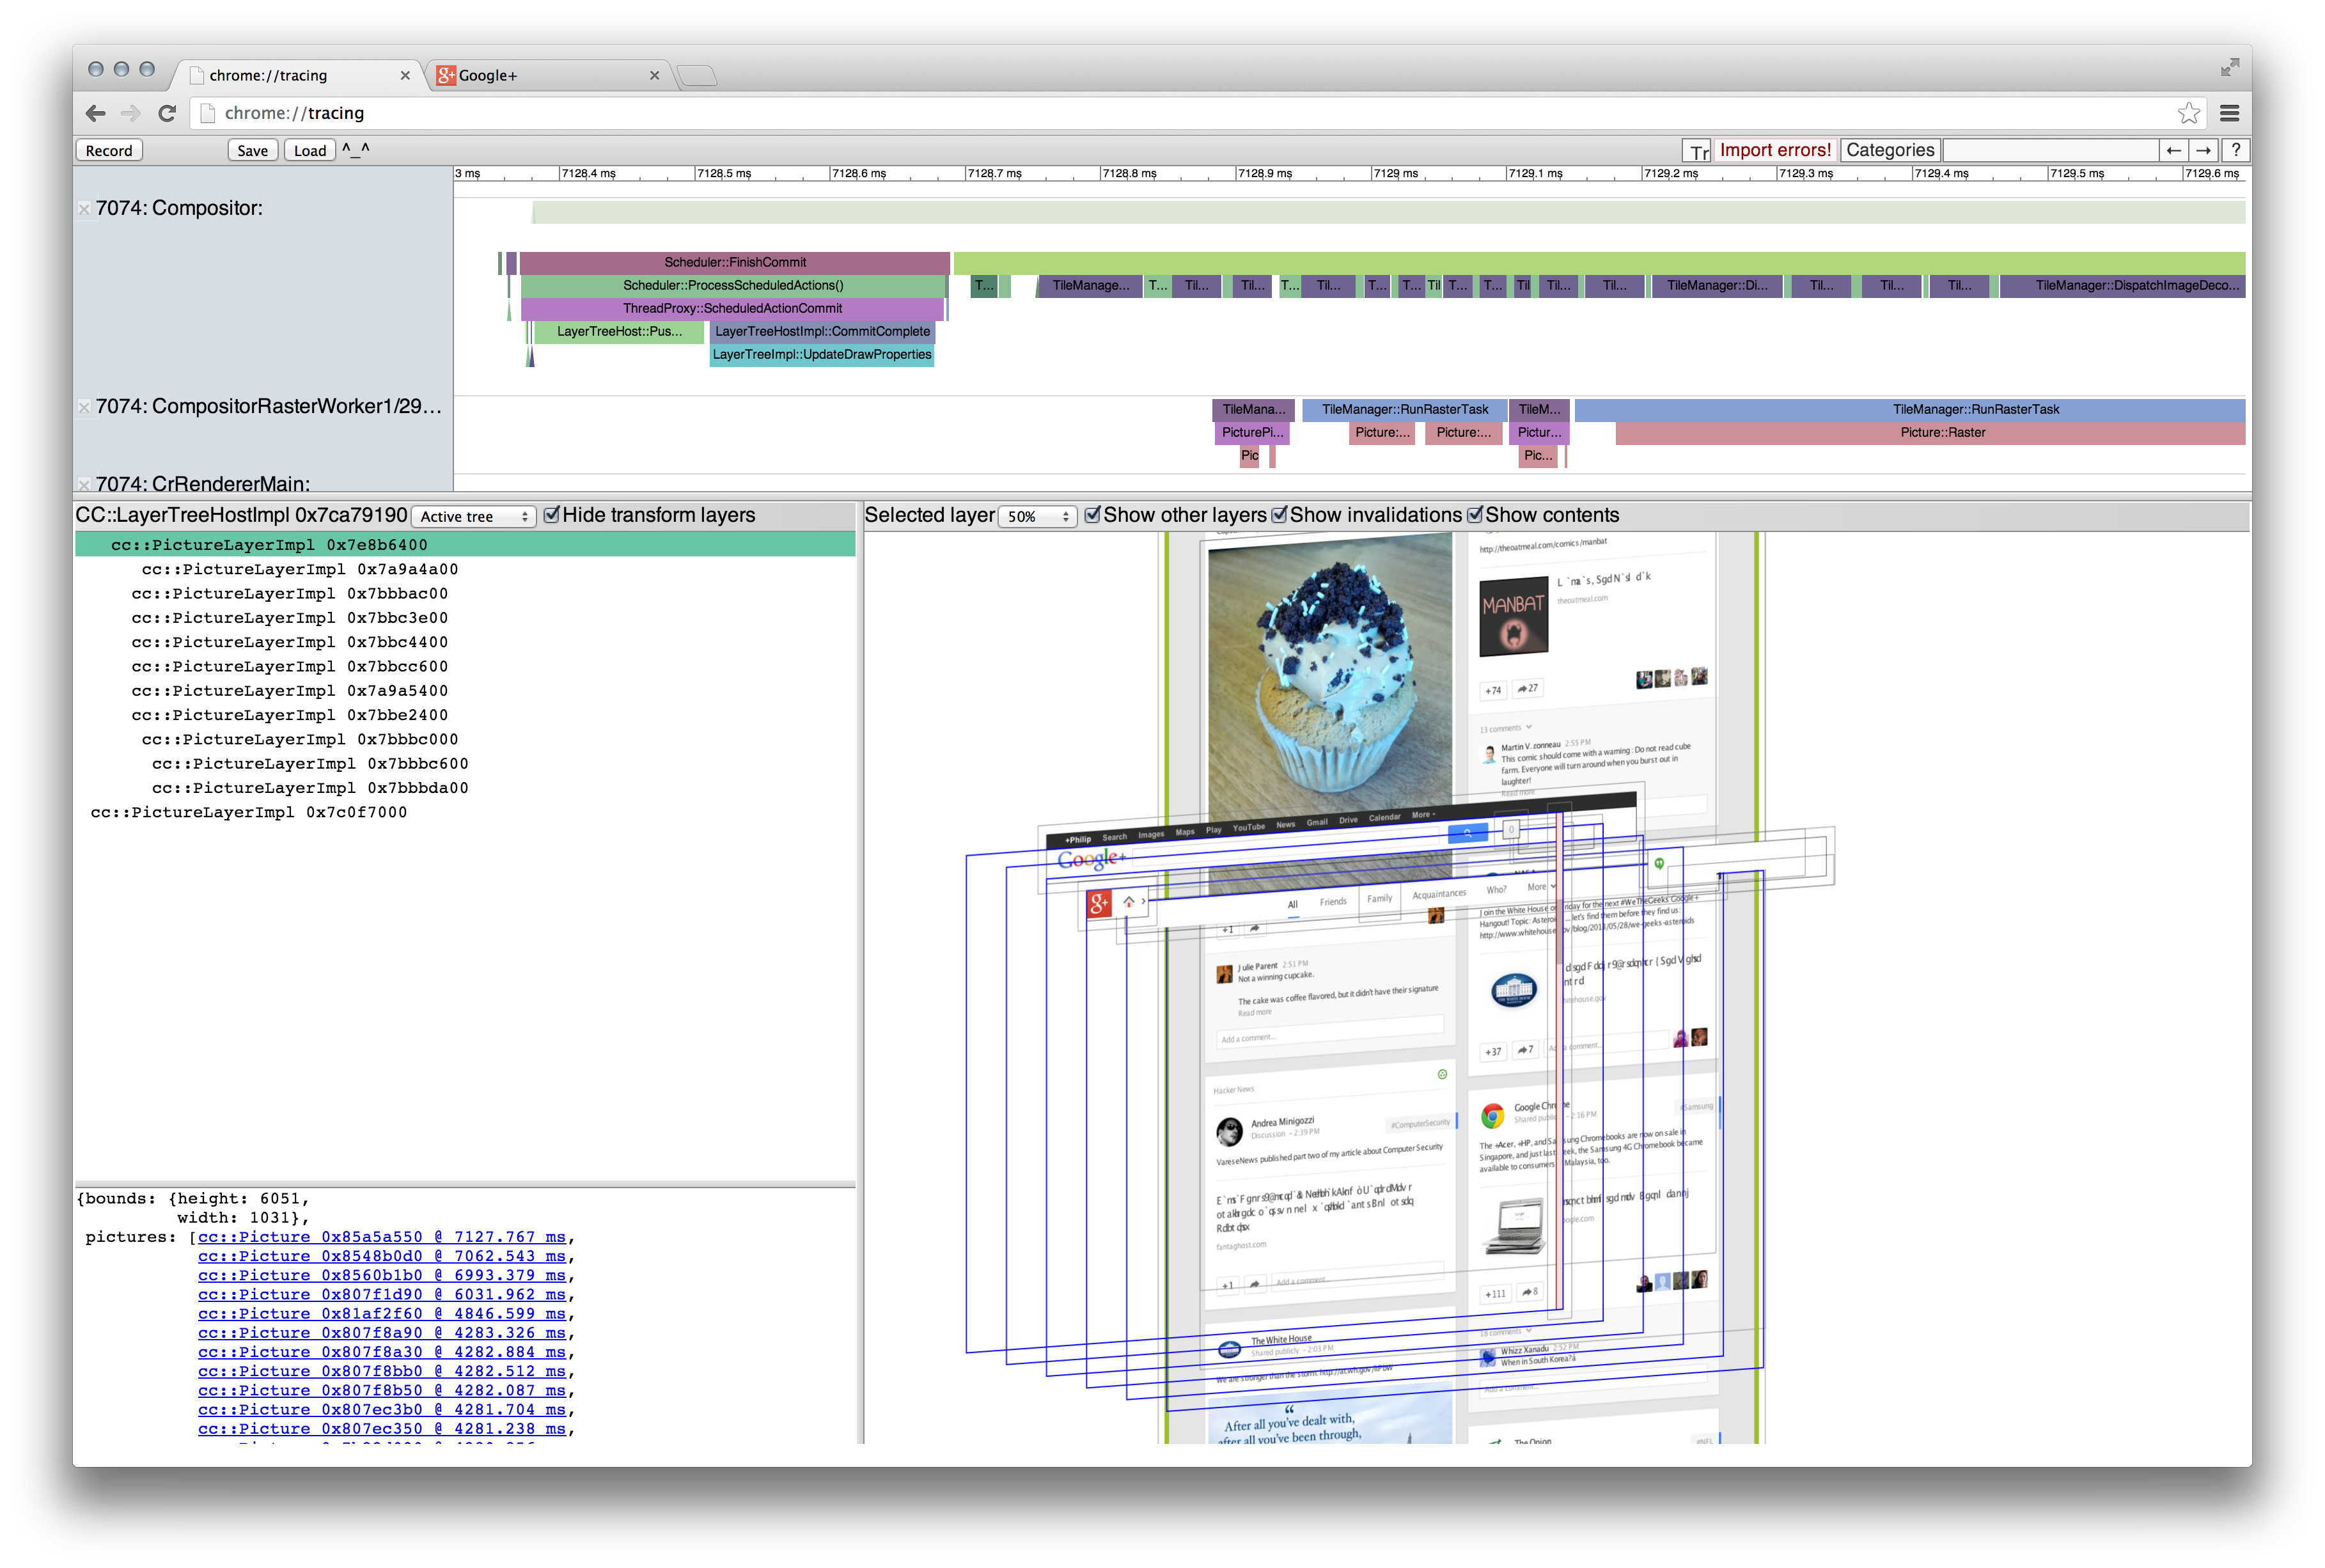
- How to use the Frame Viewer to Bust Jank; read this next, to understand how to diagnose rendering performance problems.
- Jank Case Study 1; then read this, for further examples of how to effectively use about:tracing in conjunction with the Dev Tools timeline
Note that to understand what's happening in trace events you'll need a basic understanding of how the browser works. The above articles provide enough to get started, but it's recommended to first read at minimum:
- The Rendering Critical Path for a little more background, and...
- Anatomy of Jank for precise explanations of various rendering performance problems
Further reading:
- A presentation from pdr@ on how to debug the graphics stack with tracing
- Frame Viewer Basics, a short guide for how to navigate the frame viewer view. This is more succinct but less informative than frame viewer how-to above.
- Saving Skia Pictures; this is useful if you want to capture isolated SkPictures for the Skia team.
- Tracking memory allocations with memory-infra tracing
Even further reading:
- How to Understand about:tracing results (somewhat out of date; refer to the Frame Viewer how-to instead)
Contributing to about:tracing
Start by perusing the Tracing Ecosystem Explainer to understand the various different pieces of code involved.
- To instrument Chrome and add your own custom traces, see Instrumenting Chromium or Javascript code to get more detail.
- To add functionality to the about:tracing viewer itself, see
contributing to
trace-viewer.
- trace-viewer lives in its own repository on GitHub, not in the Chromium tree.
Please file bugs as you find them! If you find any bugs, please let us know. You review the known bugs as well.