FrameViewer How-To
wiltzius@
For a web application to respond smoothly to user touch input the application needs to receive input events in JavaScript, react to them, and then allow time for the browser to render any changes made to the page -- all within a 16ms frame budget.
This can be challenging, and it can be instructive to look under the hood to see what the browser is doing each frame. This is what Chromium’s Frame Viewer does, although it was built with debugging Chrome in mind, not debugging web apps. Chromium devs and adventurous outsiders may nevertheless be curious what’s happening in the browser on a per-frame basis.
Prerequisites:
[Get set up to record
traces](/developers/how-tos/trace-event-profiling-tool/recording-tracing-runs);
recommended to use adb_profile_chrome.py from
<https://github.com/johnmccutchan/adb_trace> (also in Chrome’s source tree
under src/tools/perf/)

Read the [Frame Viewer
Overview](/developers/how-tos/trace-event-profiling-tool/frame-viewer) for
information on how to record a frame viewer trace, rather than a standard
trace. The short version is you need a number of non-default tracing
categories enabled; the easiest way to do this is to use the
adb_prorfile_chrome script (see above) and pass --trace-frame-viewer to it.

Frame-viewer only works on the latest versions of Chrome, and with the
latest rendering architecture. For some features to work both the version of
Chrome used to view traces and the version used to record traces must be run
with impl-side-painting enabled (--enable-impl-side-painting), and the
version of Chrome used to view the trace must be run additionally with
--enable-skia-benchmarking. See Frame Viewer’s [Getting
Started](/developers/how-tos/trace-event-profiling-tool/frame-viewer) for an
example command line.

This entire document assume you know a lot about how the web platform works
and a lot about how Chrome works. Performance of a sophisticated rendering
system like a modern browser is very complicated, so please do not use this
to blindly infer that any particular operation is cheap or expensive --
rather, use this tool to inform your own experimentation and debugging.
Simplified Version of Browser Rendering
Before trying to read a Frame Viewer trace, a few fundamentals:
After it's loaded, the page changes in response to two inputs: user interaction mediated by the user agent (default pressed button styles, scrolling, etc) and updates to the DOM from JavaScript. From there, a cascade of effects through several rendering sub-systems eventually produces new pixels on the user’s screen.
The main subsystems are:
Parsing, which turns a chunk of HTML into DOM nodes

Style, which resolves CSS on the DOM

Layout, which figures out where DOM elements end up relative to one another

Paint setup, sometimes referred to as recording, which converts styled DOM
elements into a display list (SkPicture) of drawing commands to paint later,
on a per-layer basis

Painting, which converts the SkPicture of drawing commands into pixels in a
bitmap somewhere (either in system memory or on the GPU if using Ganesh)

Compositing, which assembles all layers into a final screen image

and, less obviously, the presentation infrastructure responsible for
actually pushing a new frame to the OS (i.e. the browser UI and its
compositor, the GPU process which actually communicates with the GL driver,
etc).
We’ll focus on 1-6; the browser compositor and GPU process take up resources too but these operations don't map very meaningfully to page content.
Adding a new DOM element that’s visible on-screen will trigger work in every one of the systems above. In bad cases any one of them can cost tens of milliseconds (or more), meaning every one of them can be considered a liability for staying within frame budget.
One way to keep your animations inexpensive is to avoid stages of this pipeline altogether. For instance, if the DOM remains untouched in a given frame but one particular <div> changes from a red background to a blue background, no parsing needs to happen -- but style needs to be updated on at least that <div>, and because CSS’s inherited nature this can often trigger style recalculation on other parts of the DOM as well.
Note that user interactions that the browser handles, rather than the application, are largely unexceptional: clicking a button changes its style (adding pseudo-classes) and those style changes need to be resolved and later stages of the pipeline run (e.g. the depressed button state needs to be painted, and then the page needs to be re-composited with that new painted content).
The browser has multiple threads, and because of the dependencies implied in the above pipeline which thread an operation runs on matters a lot when it comes to finding the rendering bottleneck. Style, layout, and some paint setup operations run on the renderer’s main thread, which is the same place that JavaScript runs. Parsing gets its own thread (in most cases), as does compositing and painting.
Keep in mind that JavaScript is single threaded and does not yield by default, which means that JavaScript events, style, and layout operations will block one another. That means if e.g. the style system is running, Javascript can’t receive new events. More obviously, it also means that other JavaScript events (such as a timer firing, or an XHR success callback, etc) will block JS events that may be very timely -- like touch events. NB this essentially means applications responding to touch input must consider the JavaScript main thread the application’s UI thread, and not block it for more than a few milliseconds.
The above explanation simplifies a lot, but should be enough to get going. Two exceptions worth pointing out though: first, scrolling is “special” in that it happens outside of the main JavaScript context, and scroll positions are asynchronously reported back to the main thread and updated in the DOM. This prevents janky scrolling even if the page executes a lot of JavaScript, but it can get in the way if the page is well-behaved and wants to respond to scrolling. Second, the pipeline above isn’t strictly hierarchically ordered -- that is, sometimes you can update style without needing to re-lay-out anything and without needing to repaint anything. A key example is CSS transforms, which don’t alter layout and hence can skip directly from style resolution (e.g. changing the transform offset) to compositing if the necessary content is already painted.
Introducing Frameviewer
For the rest of this document to make sense you’ll need to get set up to record frame viewer traces. See the Frame Viewer Overview for instructions.
Caveats: Frame Viewer only works on the very latest Chrome rendering architecture (both for the Chrome where the trace is recorded and the Chrome where its viewed; see the above link for info on how to get Chrome into that mode), and it… can be buggy. Don’t say we didn’t warn you.
Let’s start with something simple. Here’s a frame viewer trace of scrolling mobile.nytimes.com
The trace file being screenshotted in this section is attached to this page, as are all the traces referenced here, and can be downloaded and opened in about:tracing to follow along.
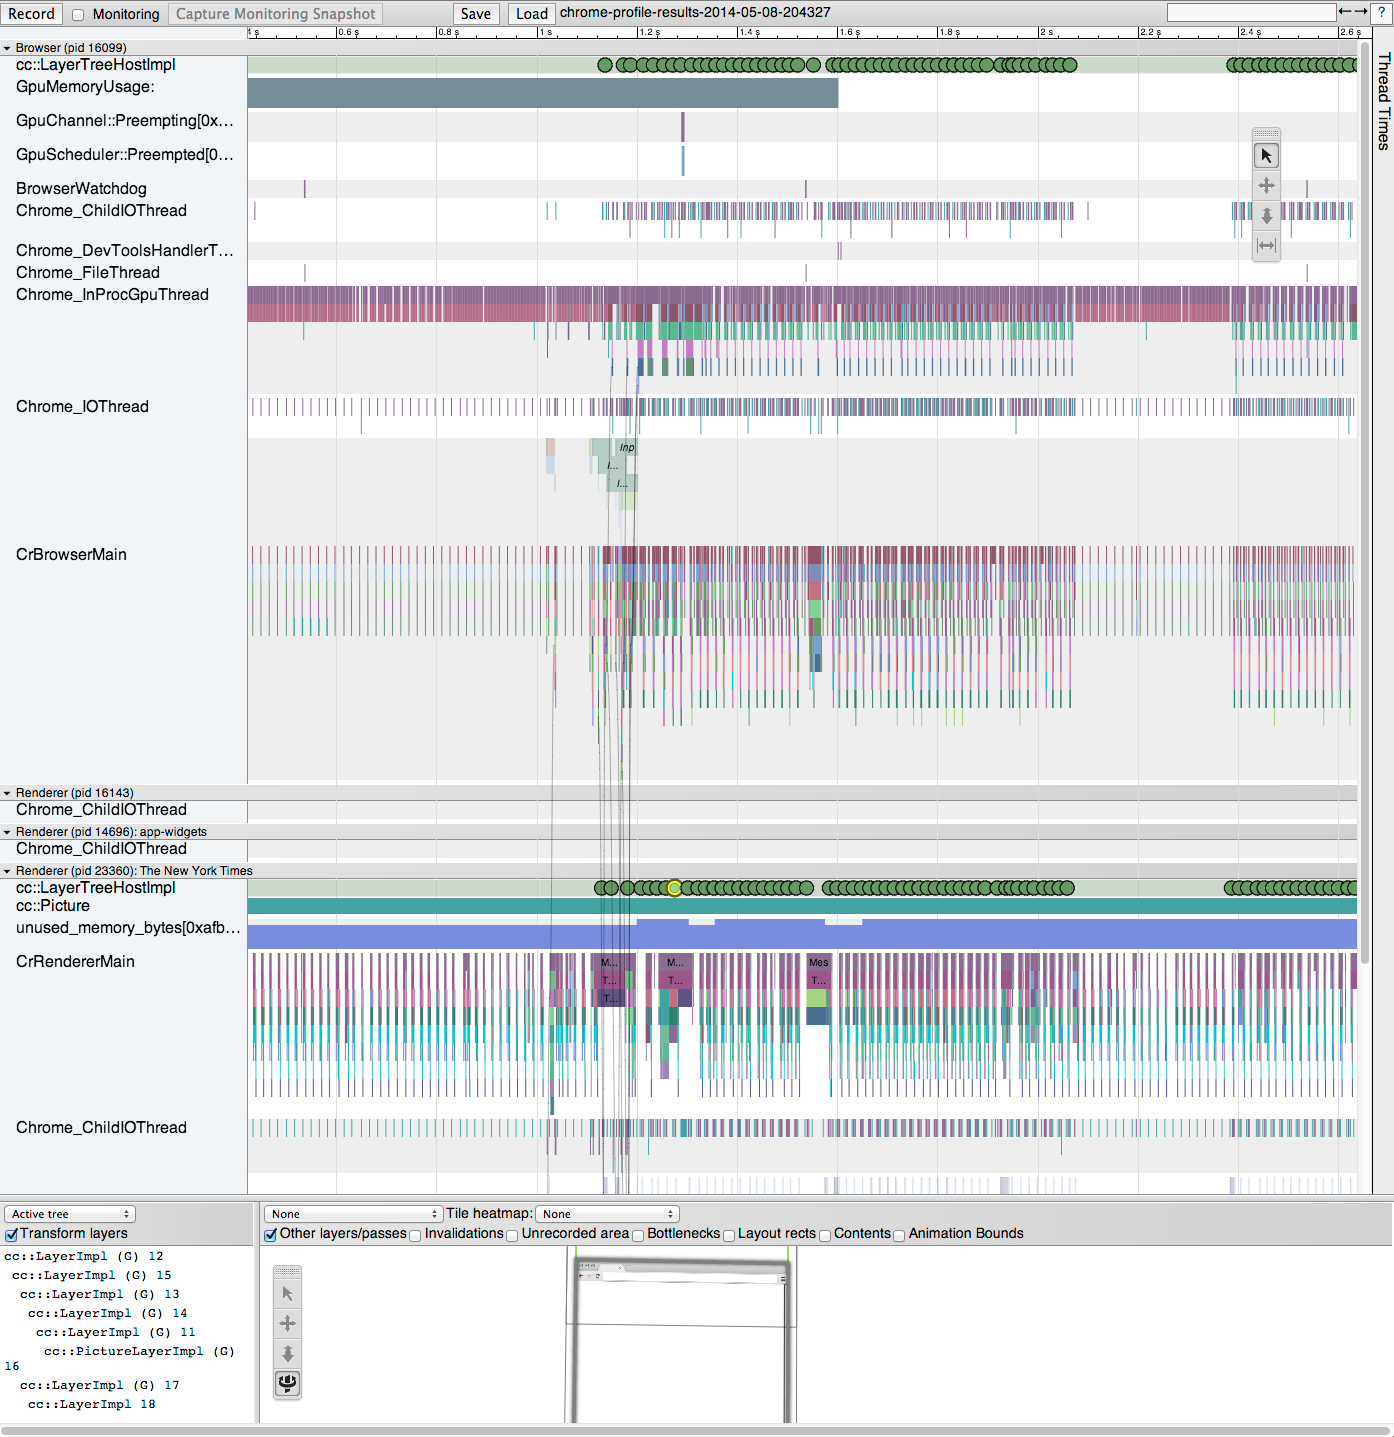
Lots of stuff on the screen. Let’s try to make sense of it.
Navigating the Basic Tracing View
Before even touching the Frame Viewer, let’s examine some standard trace events as a refresher. There’s more detail in this document about trace events and how to read them, but it’s a bit stale. Below is an updated, shortened recap.
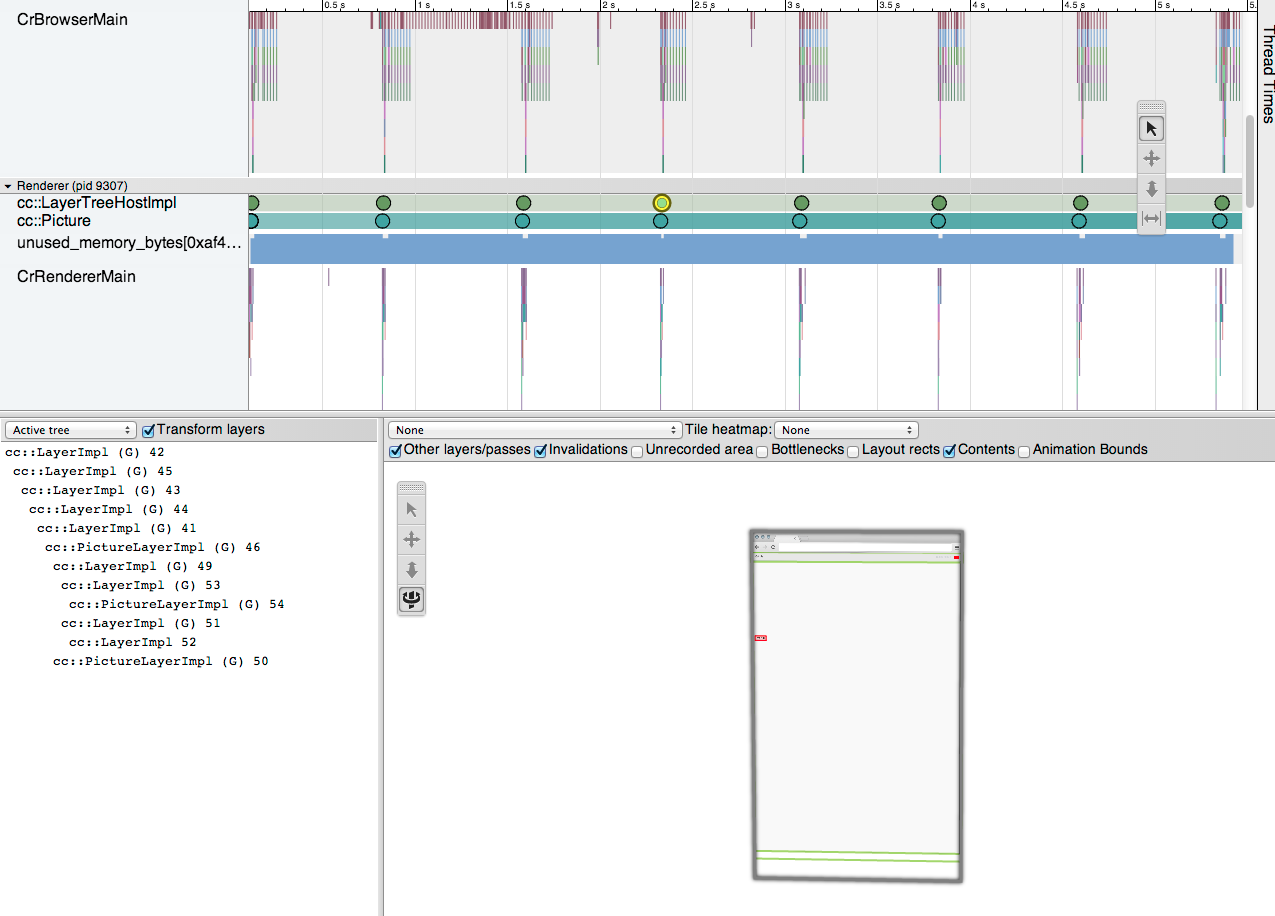
Processes & Timelines
What you’re seeing is Chrome's multi-process architecture at work, scrolling your page. The first thing to notice is that there are three processes running: the browser (pid=16099) and the renderer process for nytimes.com (pid=23360).
Each process has a separate horizontal track, filled with trace events. The track is basically an event timeline for events on that thread/process. Events are the colored, rectangular blocks on the timeline tracks. Time moves from left to right.
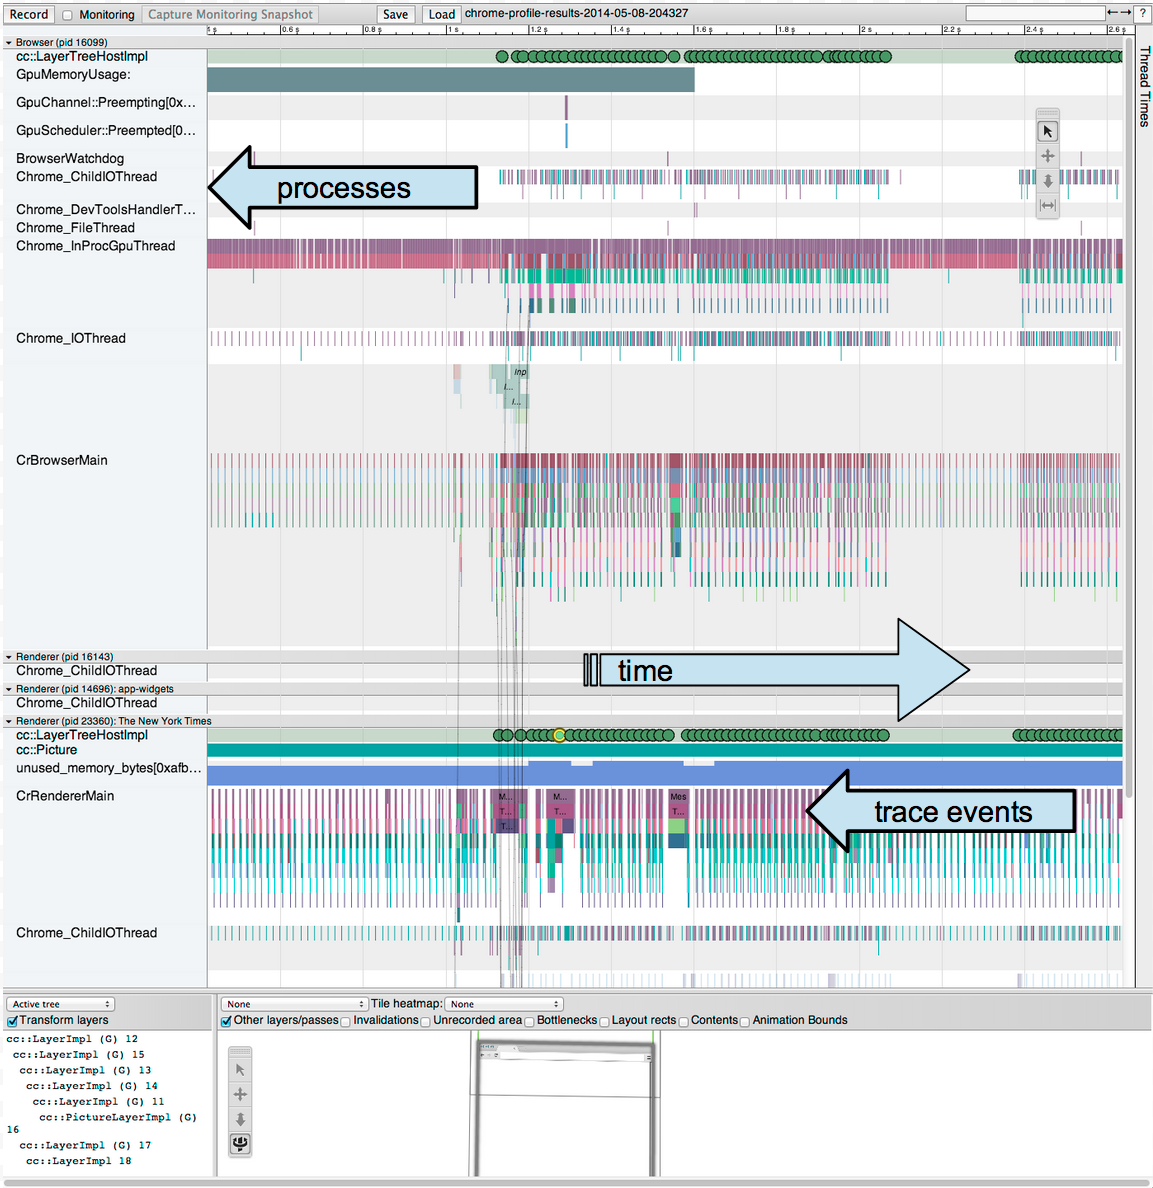
Panning and Zooming with the Keyboard
The keyboard can be used to zoom and pan around inside the timeline. The ‘w’ and ‘s’ keys zoom in centered around the mouse, and the ‘a’ and ‘d’ keys pan the timeline left and right.
Trace Events
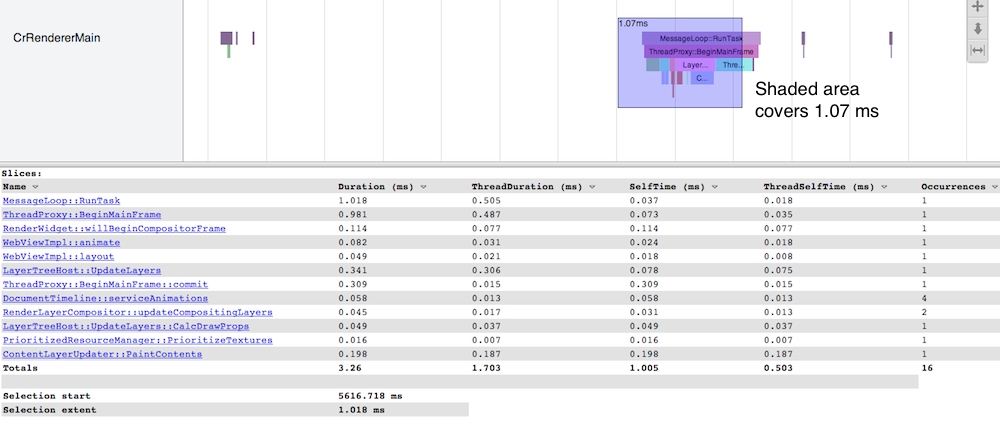
In this case, the data being shown is ~5 seconds. Zooming in on a section of the trace for more detail, we can make out individual trace event records.
A single rectangle represents a TRACE_EVENT: where it began, and where it ended. When you see a stack of different rectangles on top of each other, it means that trace events were issued inside one another on the same thread. For example:
foo() {
sleep 10ms
bar()
sleep 5ms
}
bar() {
sleep 5ms
}
Would look like this:
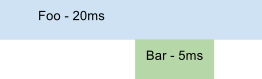
To study individual rectangles, you can click on them. This will display information about the rectangle: its Duration, ThreadDuration (CPU time), SelfTime (time spent in the current slice, subtracting the time of all the children slices), ThreadSelfTime (CPU time spent in the current slice, subtracting the CPU time for all the children) and Occurrences (the number of times that event appeared in the selection). The information is sortable. Clicking on a title from the info table will expand all the slices for that event.
For the Foo/Bar example, the SelfTime for Foo will be 15ms (20 - 5), while the SelfTime for Bar will be 5ms (Since it has no traced children).
The ThreadDuration is not available for all events and for all platforms, the SelfTime is omitted in cases where the Slice has no known children. Asynchronous events have no SelfTime by definition.
In addition to clicking, you can drag the mouse in a rectangle over a group of trace events. This will give you a list of events that intersect that rectangle and summarize them for you:
Navigating Frame Viewer Mode
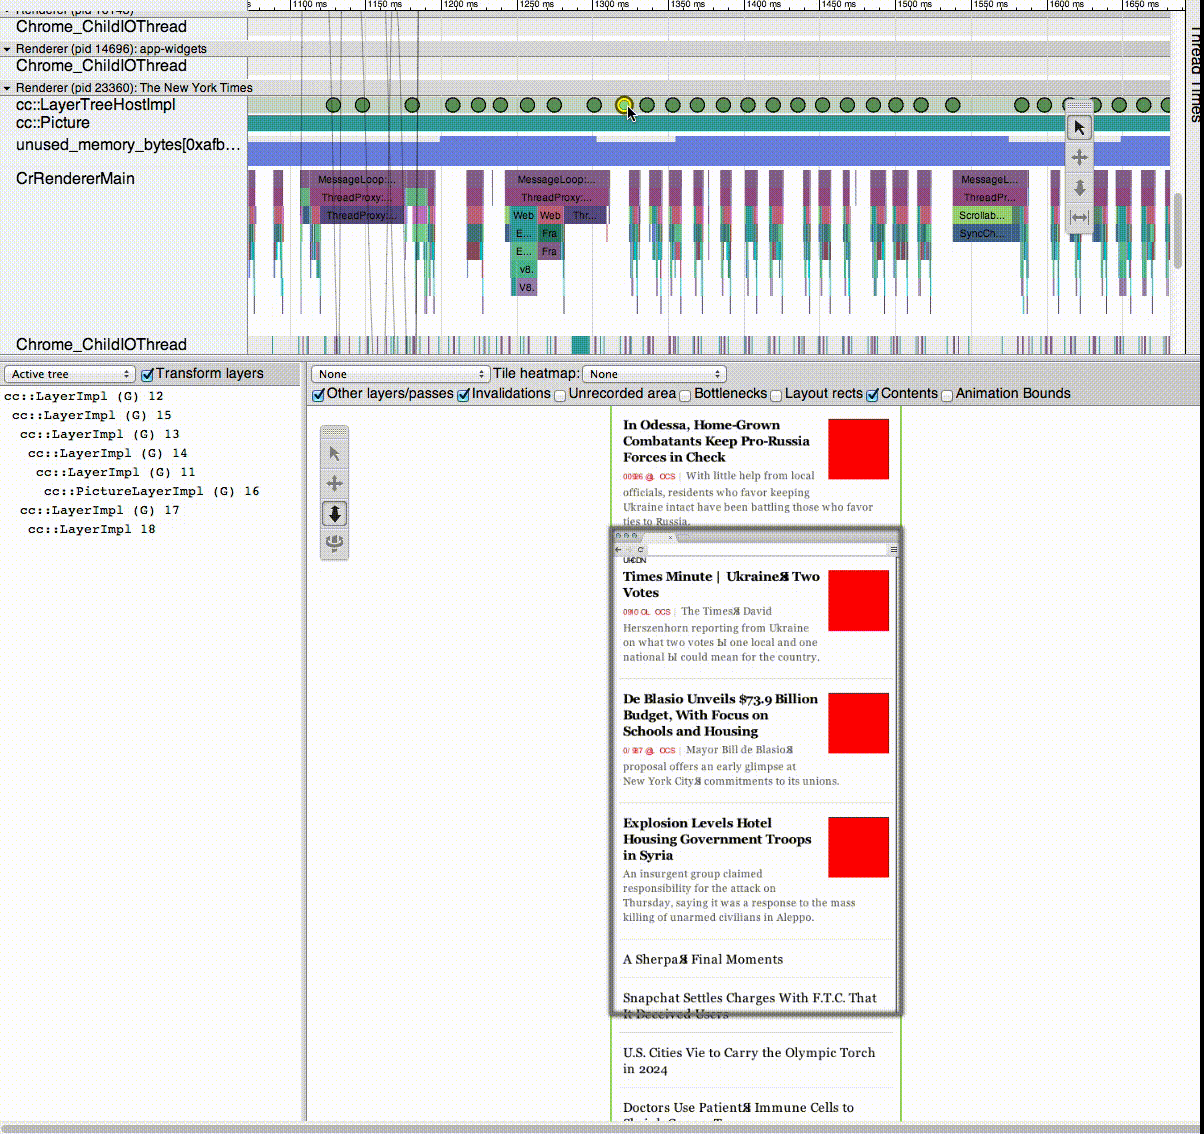
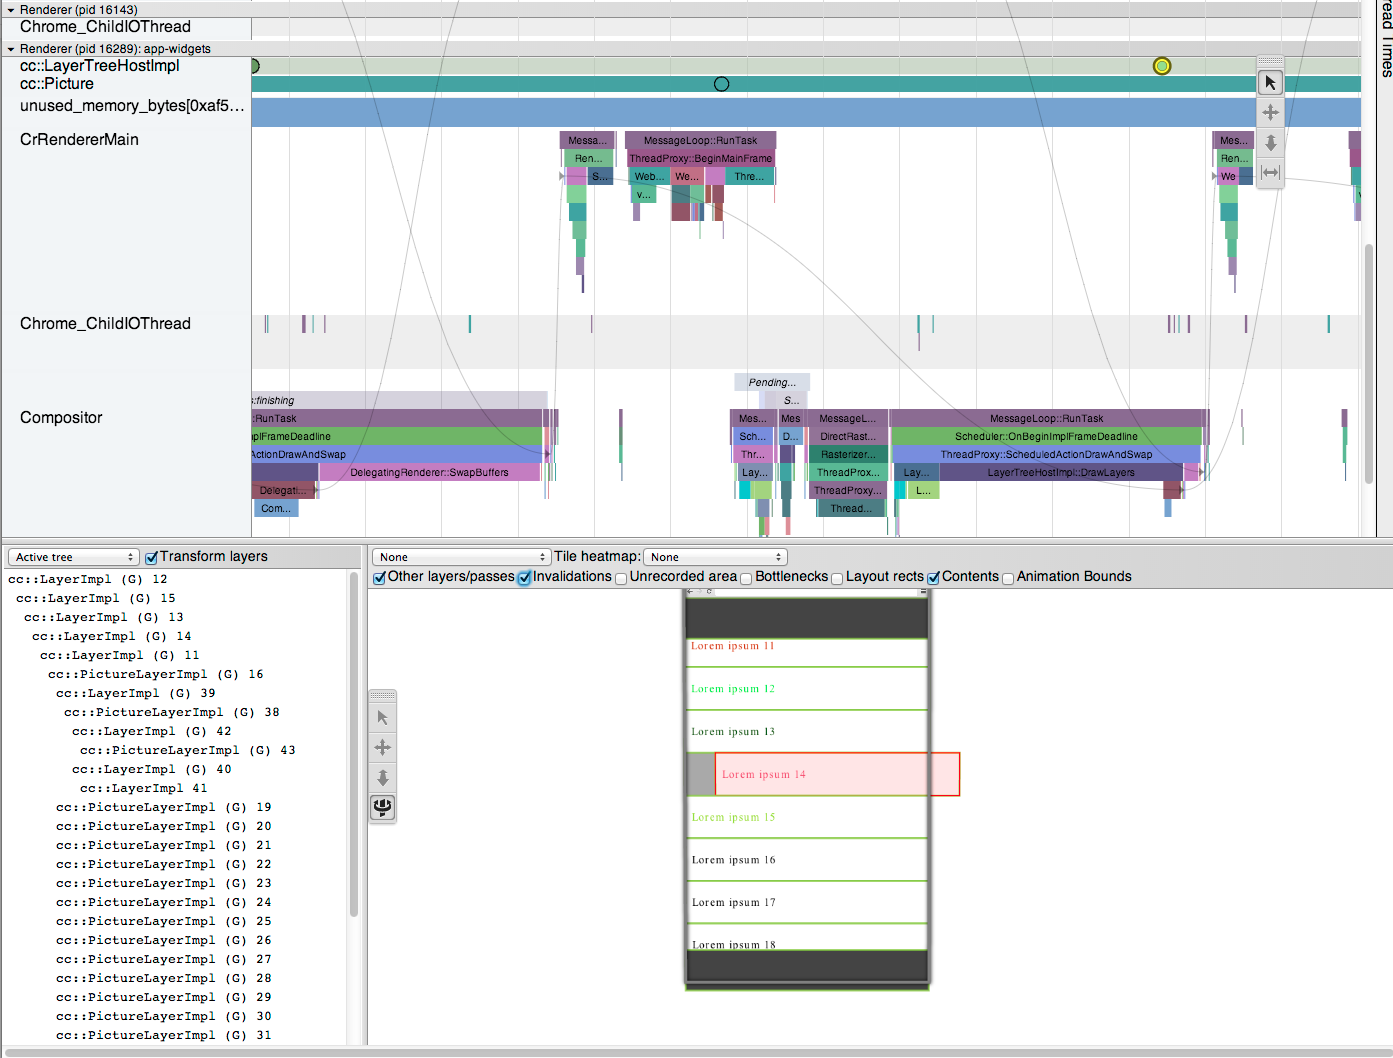
What Frame Viewer adds beyond the basic trace event system is a dump of the page’s state taken each time the renderer produces aframe. This is very useful when trying to visualize what’s happening from frame to frame. To see the state of the page’s layer tree for a frame, click one of the green circles along the top of the Renderer process track:

You’ll get frames on the bottom of the screen that show the browser’s layer tree for this frame (on the left) as well as an image of the page with outlines for all the page’s layers (on the right).
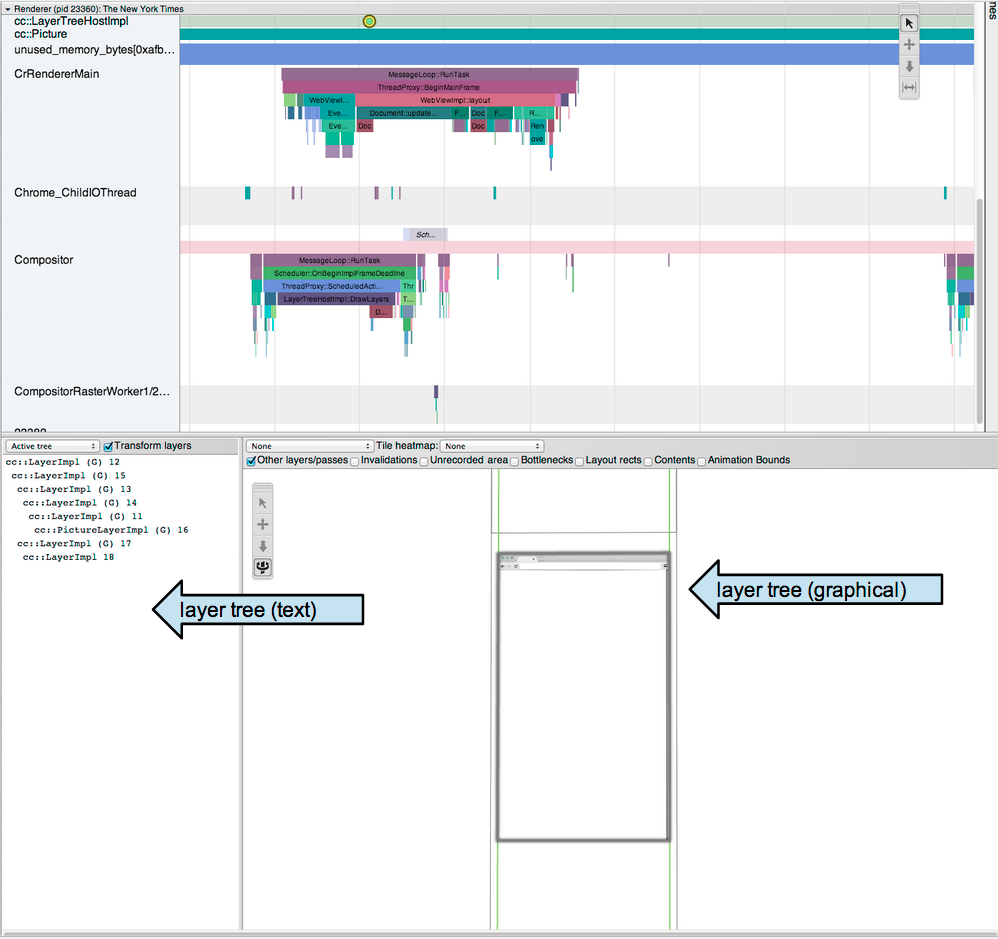
Checkboxes in the layer view control what information is included in the page visualization: the most useful are typically “other layer’s / passes” (to view the whole page, rather than just the layer selected), “invalidations” which shows what got dirtied that frame for repainting, and “contents” which attempts to fill in the actual pixels for each layer by rasterizing the SkPictures for each layer (the SkPicture being essentially a DisplayList Chrome internally uses to store paint operations and which also gets dumped along with the layer tree each frame when frame viewer is on). The “contents” view doesn’t always work well (e.g. text gets garbled) and you’ll need --enable-skia-benchmarking passed to whatever Chrome you’re using to view the trace.
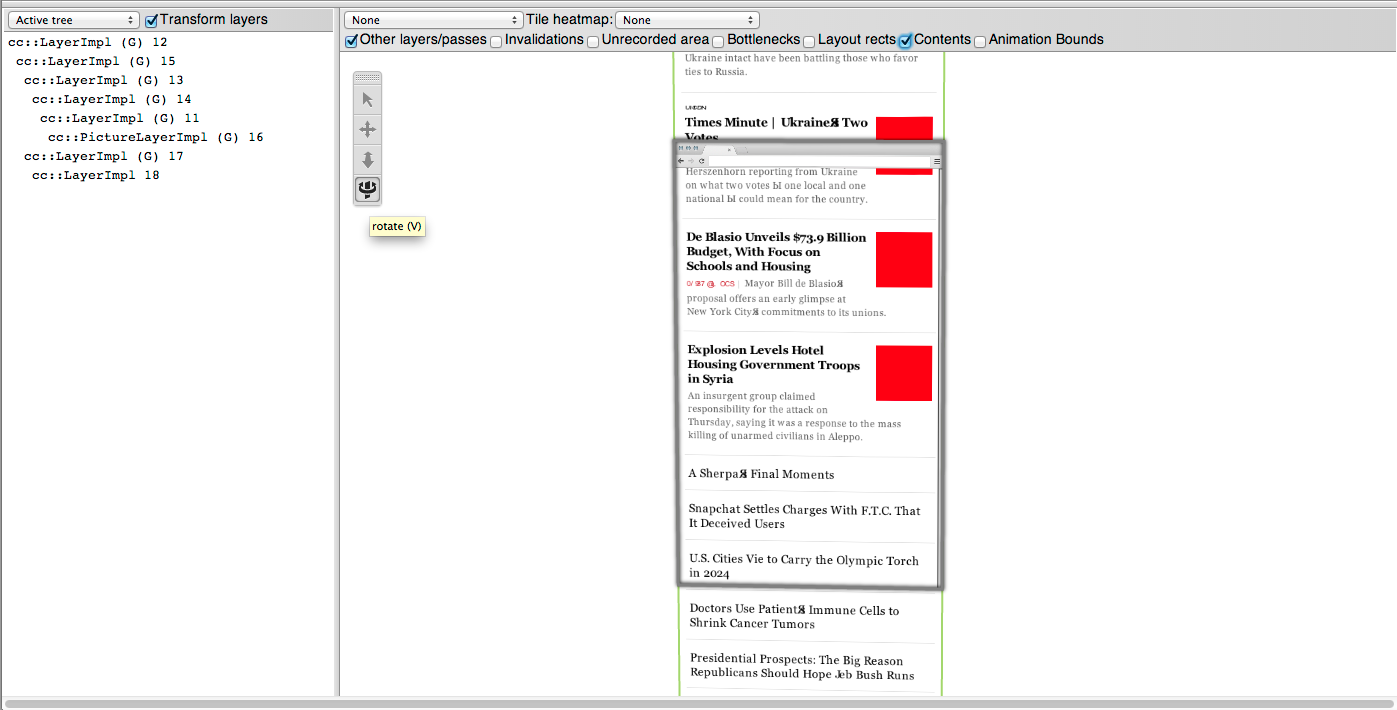
The layer visualization can get crowded, so the mouse controls are very useful.
You can pan with  ,
zoom in and out with
,
zoom in and out with  ,
and rotate (in 3D, because we’re nerds) with
,
and rotate (in 3D, because we’re nerds) with  ,
while
,
while  allows you to select a layer for more detail about it.
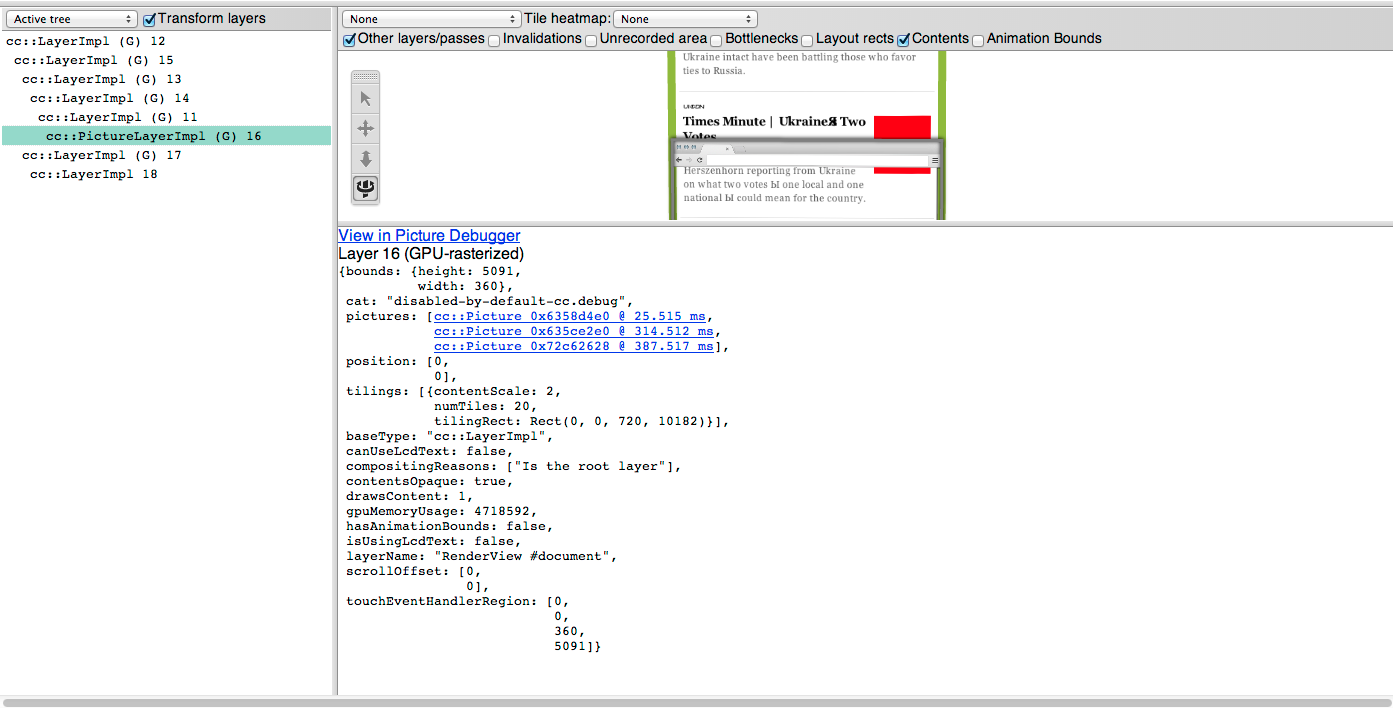
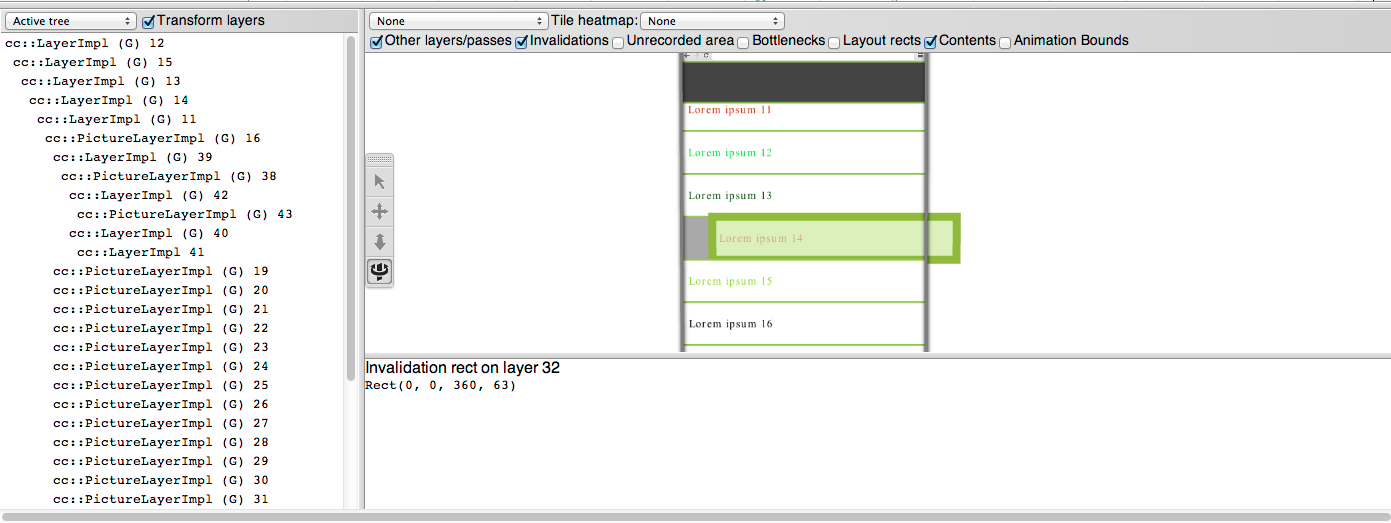
When selected everything the compositor knows about the layer is shown in the bottommost frame. The “layerName” property is interesting because it maps the layer back to its root element in the DOM, such as div#content or the #document
Selecting an invalidation tells you what layer the invalidation happened on as well as the invalidation’s bounds. Cross-reference the layer number with one of the layers in the layer tree on the left for more info about that layer.
Layers with invalidations have SkPictures associated with them. Clicking on the SkPicture link will show you more information about the relevant SkPicture recording. You can also access these recordings by selecting the blue dots along the top of the Renderer’s track in the trace view; the pictures will appear at different times than the frames because they’re located at the time they got recorded, rather than the time they were played back to produce a frame. This might be within the same frame, if an on-screen invalidation occurred that frame, or it might be much earlier if a picture was recorded and the compositor has been using the picture to produce frames for some time afterward (this will happen with composited scrolls and with CSS transform animations in particular, since the compositor can run these on its own).
Frame viewer’s best feature is that is captures all of this information on a per-frame basis. The arrow keys move between frames while trying to retain the same view, so you can step through frame by frame and watch layer positions move with respect to one another or see invalidations appear.
This information, combined with the timing information encoded in the trace events, provides a powerful view into the performance of a web application.
The Critical Path
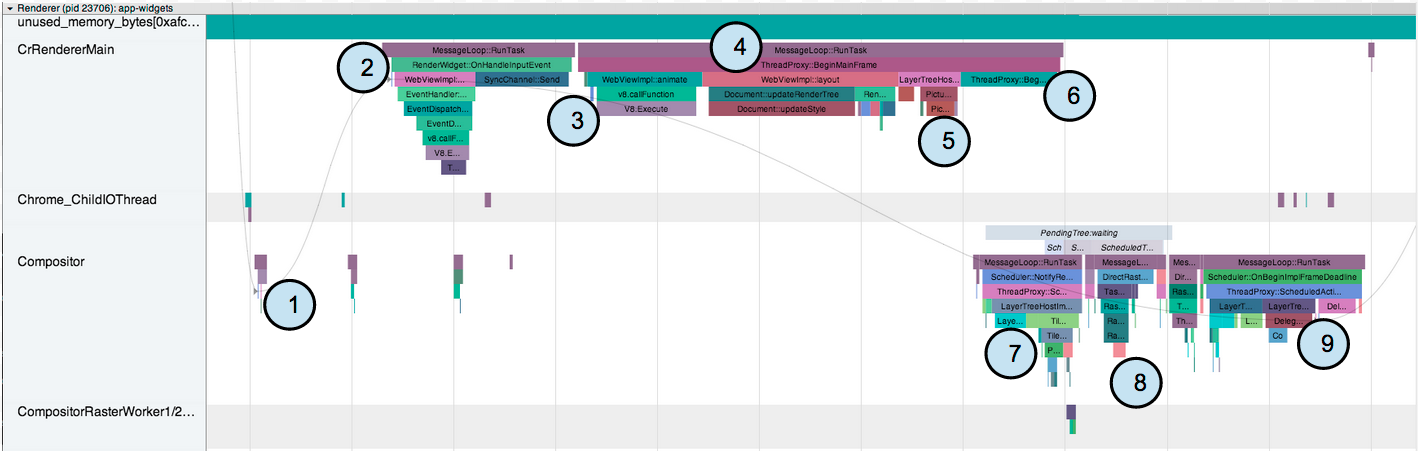
Taking a trace of a page that makes a change that requires repainting in response to touch input illustrates the entire pipeline in action (and in this case, working well).
The traces in this section are all from inbox_app.html in the Silk page set. The trace files used are available here (normal trace) and here (frameviewer trace).
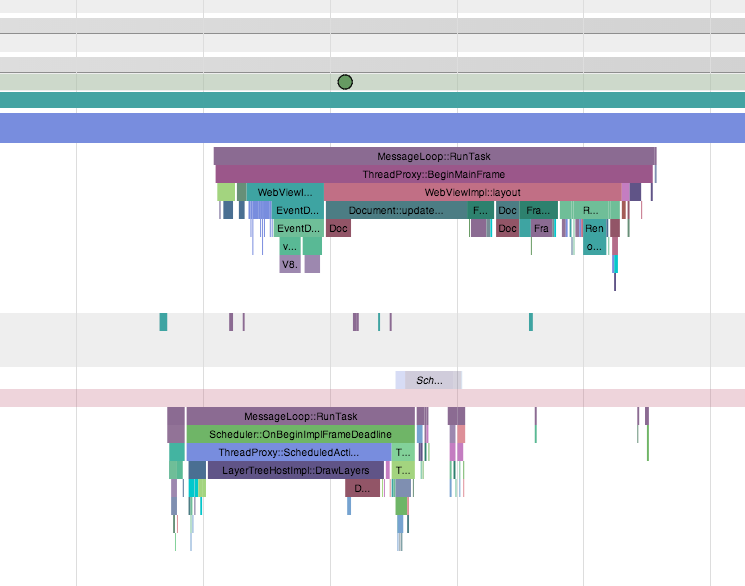
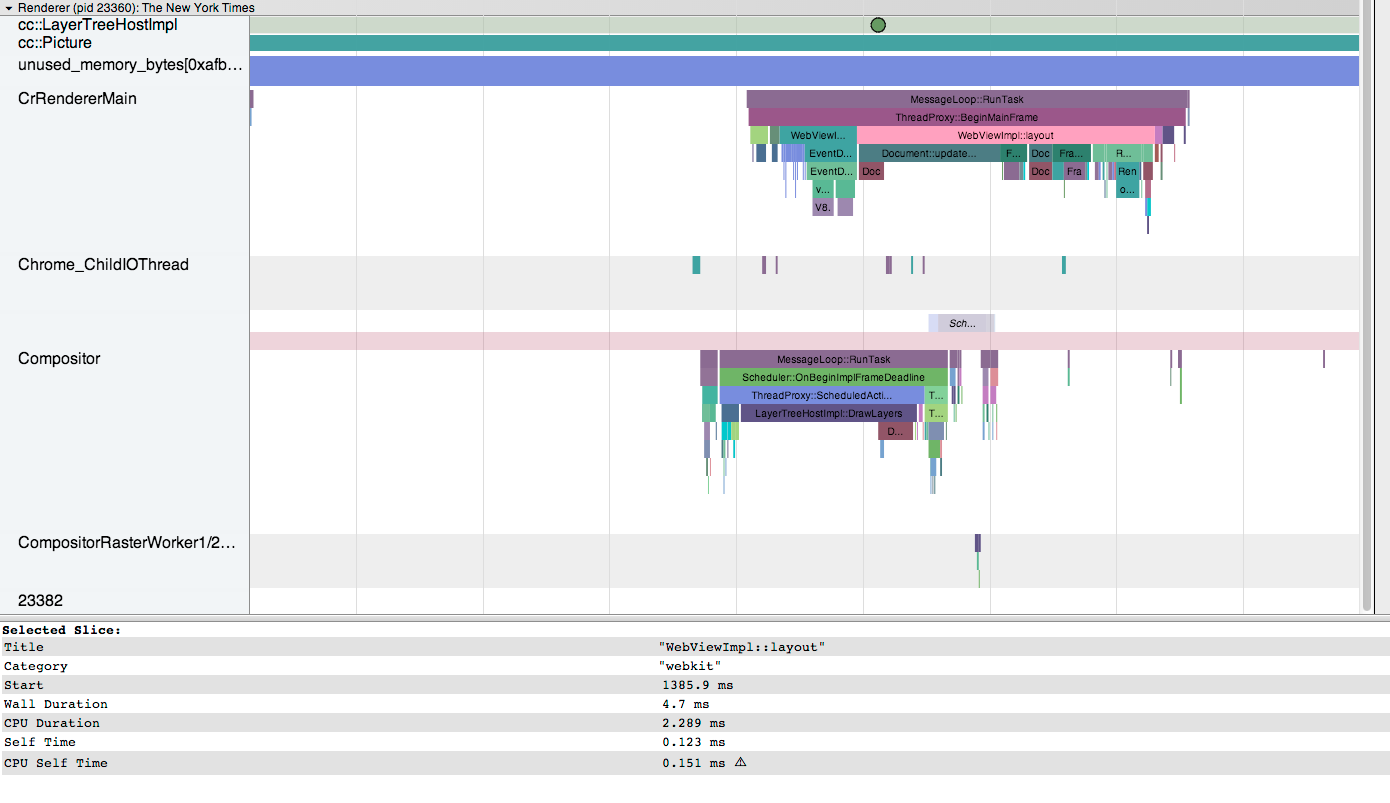
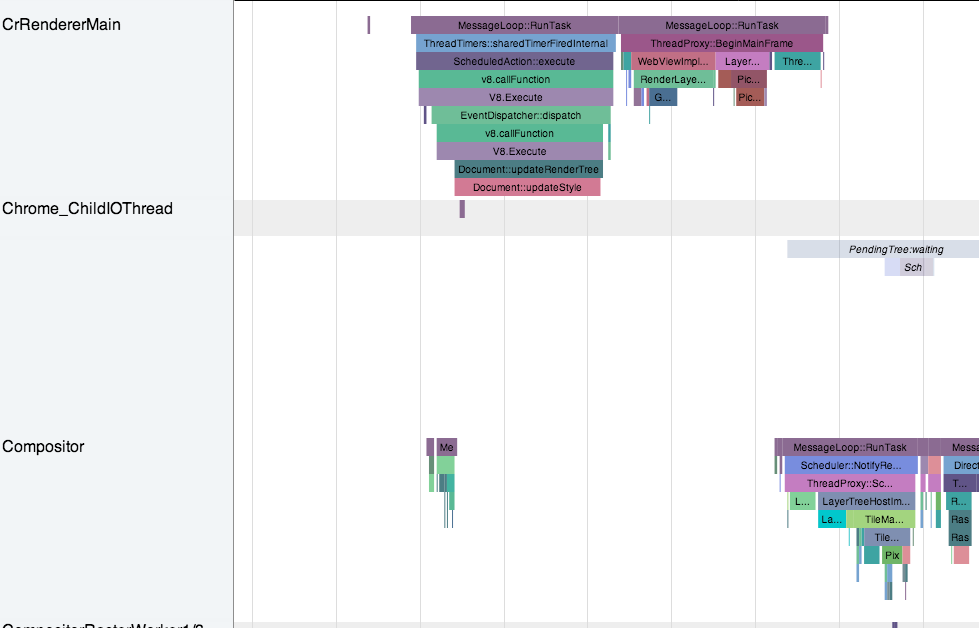
Zooming in it’s possible to follow a frame propagating through the Renderer process:
Open the trace file yourself to zoom in further and see individual events
Input event comes in from the browser process (not shown, but visible in its
own track higher up in the trace) and gets delivered to the compositor
thread. This is a tiny slice in the above trace that includes
“InputEventFilter::ForwardToHandler”

The input event gets routed from the compositor thread to the main thread.
This kicks off Blink’s input event handling, bottoming out in V8 (i.e. the
JavaScript touchmove event handler running)

Blink begins a new animation frame, doing some of its own bookkeeping as
well as calling requestAnimationFrame callback inside of
“WebViewImpl::animate”

JavaScript has modified the page since the last frame (presumably either in
the rAF callback or the input event handler), triggering a layout. The first
part of this is style recalculation, visible as Document::updateStyle

Part of the on-screen DOM has been invalidated, so Blink repaints a chunk of
the screen covering the invalidated area. This records drawing commands into
an SkPicture, visible in the trace as Picture::Record events. Layer
properties (such as transforms, scroll offsets, and opacity) are also
updated in Blink’s copy of the layer tree.

The new recordings and updated layer tree are transferred from the Blink
thread to the compositor thread in ThreadProxy::BeginMainFrame::Commit.
During this time the main thread is blocked on the compositor thread.

The compositor considers the position of all layers and sorts all of the
document’s content layer tiles to decide what order to rasterize them (this
is for prioritization; on-screen tiles get highest priority followed by any
prepainted tiles that might be on the screen soon). This is the
::UpdateTilePriorities and ::ManageTiles

Some tiles needed for this frame get rasterized in Picture::Raster events
(this trace is using Ganesh to rasterize tiles, so rasterization occurs on
the compositor thread and actually represents the generation of GL commands
for the tile contents, not filling in a bitmap which happens on the GPU).

Shortly after the rasterization completes the compositor thread’s draw
deadline arrives, so it does a bunch of bookkeeping to decide where exactly
to draw each tile on the screen (LayerTreeHostImpl::PrepareToDraw) and then
sends this frame to the browser compositor (DelegatingRenderer::DrawFrame)
and swaps the framebuffer (DelegatingRenderer:SwapBuffers)
That’s the event flow, but it’s difficult (/impossible) to look at a trace and understand what actually changing on-screen in this frame.
This is where Frame Viewer comes in. In a Frame Viewer trace of the same interaction, inspecting a couple frames around this one shows how the layers are moving from frame to frame. Here’s one:
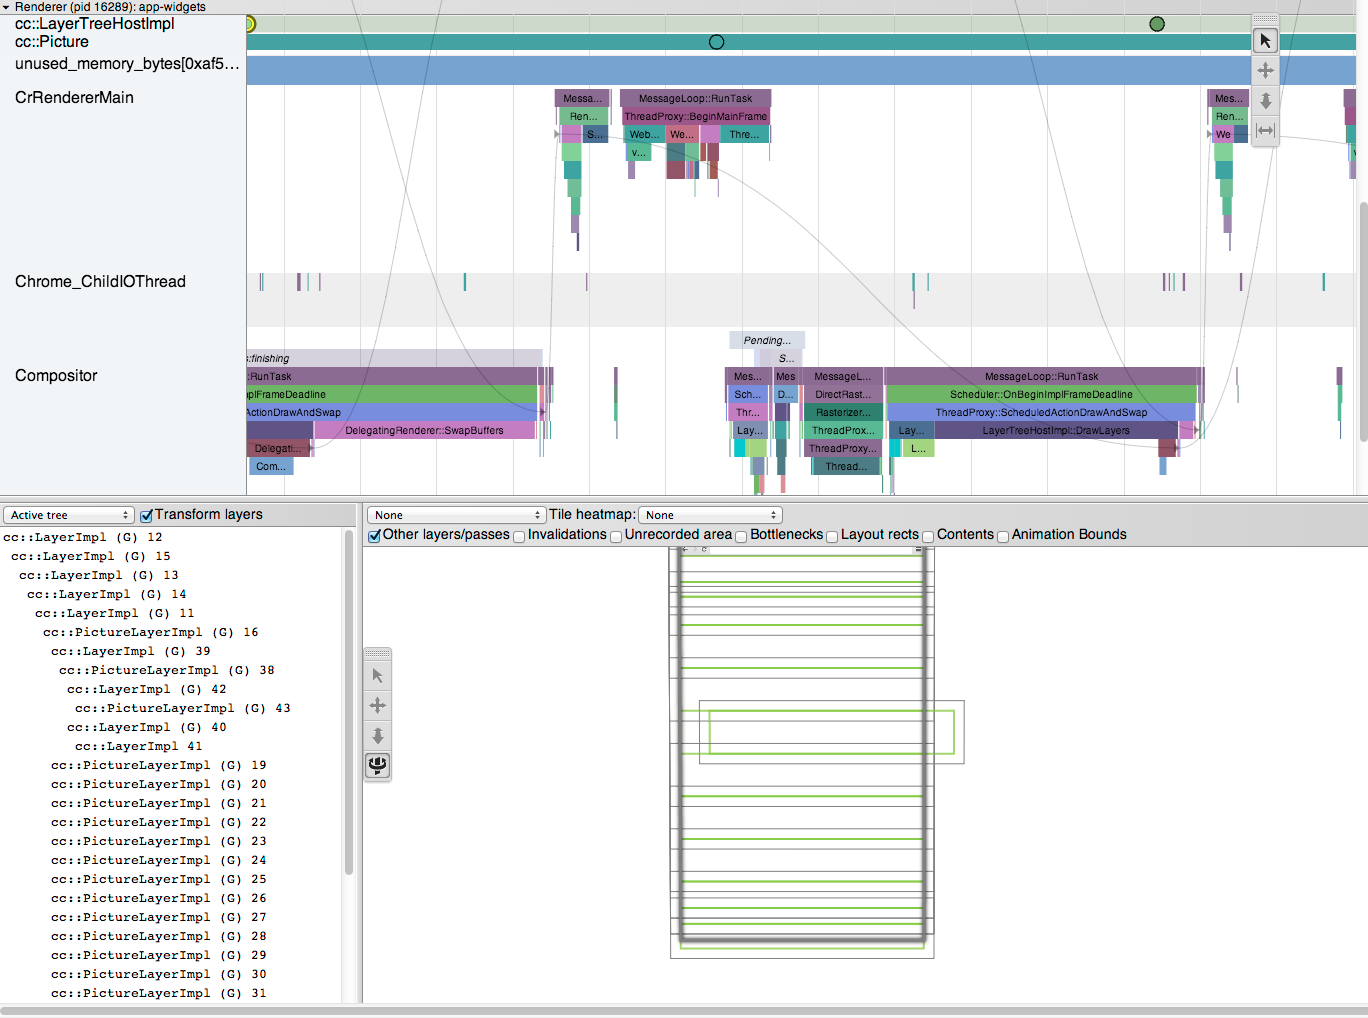
Pressing one of the right/left arrow keys lets us step to the previous/next frame. Here’s the next one:
They look almost the same, but the rectangle offset from the others, which is a layer that’s moving in response to touch input, has changed offsets slightly. Also note that a different green circle in the list of frames along the top of the Renderer track is now selected.
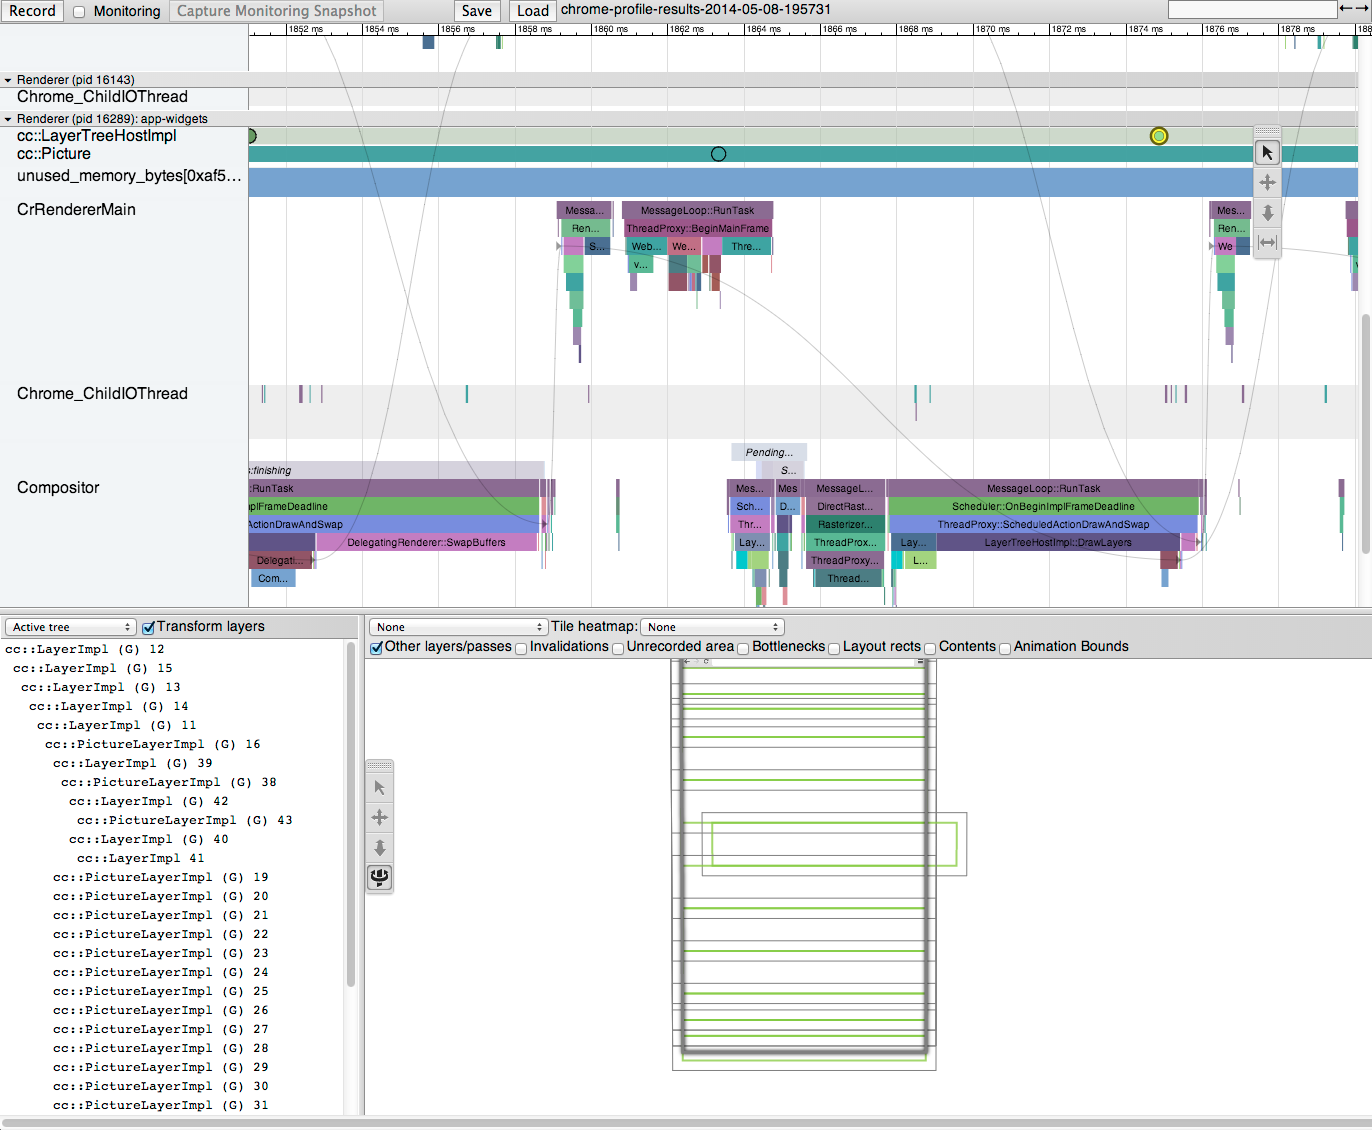
It becomes more obvious what’s changing when we enable the “Contents” checkbox:
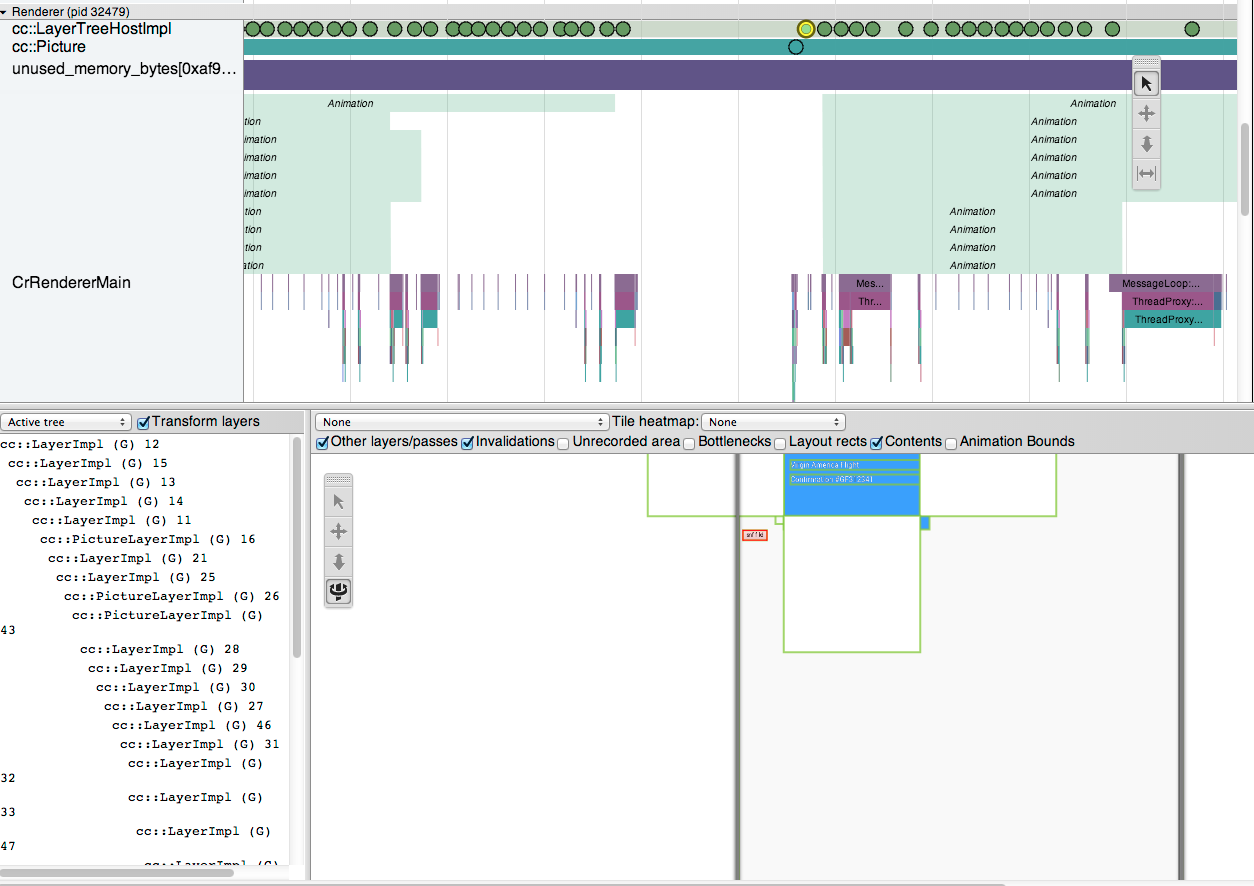
Remember from earlier we saw rasterization happen in this frame though, not just a layer changing position. You can see what got invalidated by turning on the “Invalidations” checkbox:
Clicking on the red invalidation rect, we see that it’s for layer 32:
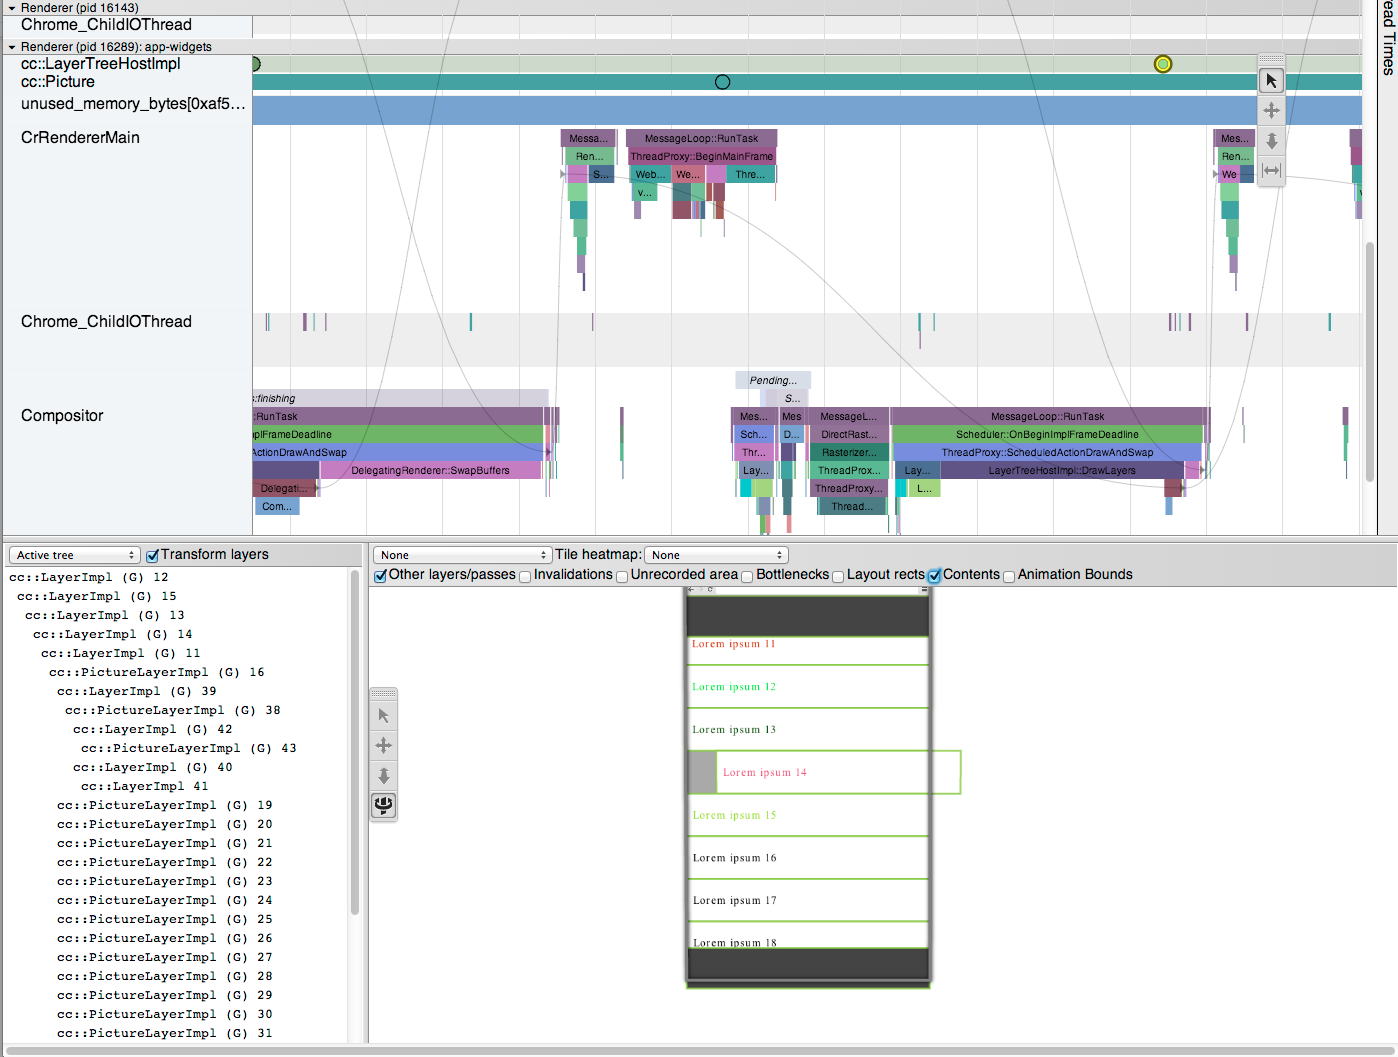
Selecting layer 32 in the list of layers on the left, or disabling the invalidations and selecting the layer itself in the viewer rather than the invalidation rect, tells us more about that layer:
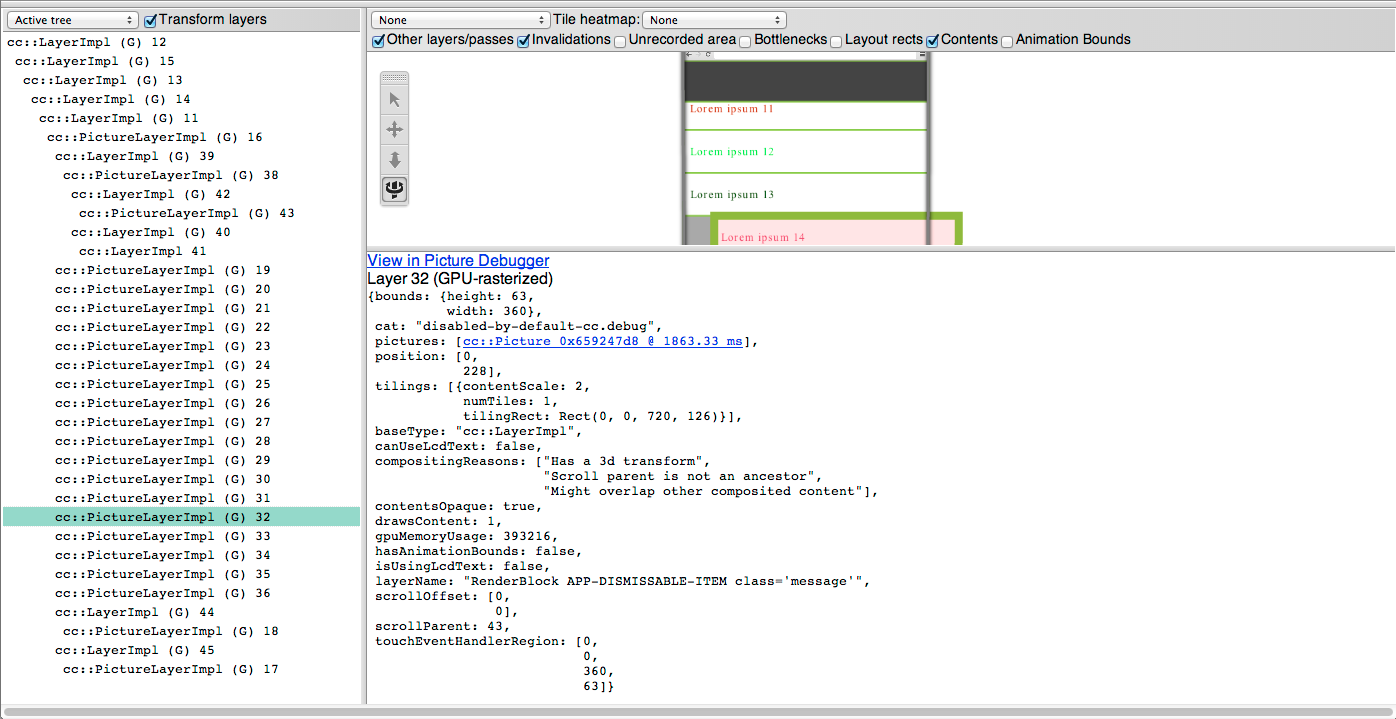
There’s a lot of information here, but the most interesting is probably the layerName which links this layer to the DOM; in this case, “RenderBlock APP-DISMISSABLE-ITEM class='message'”
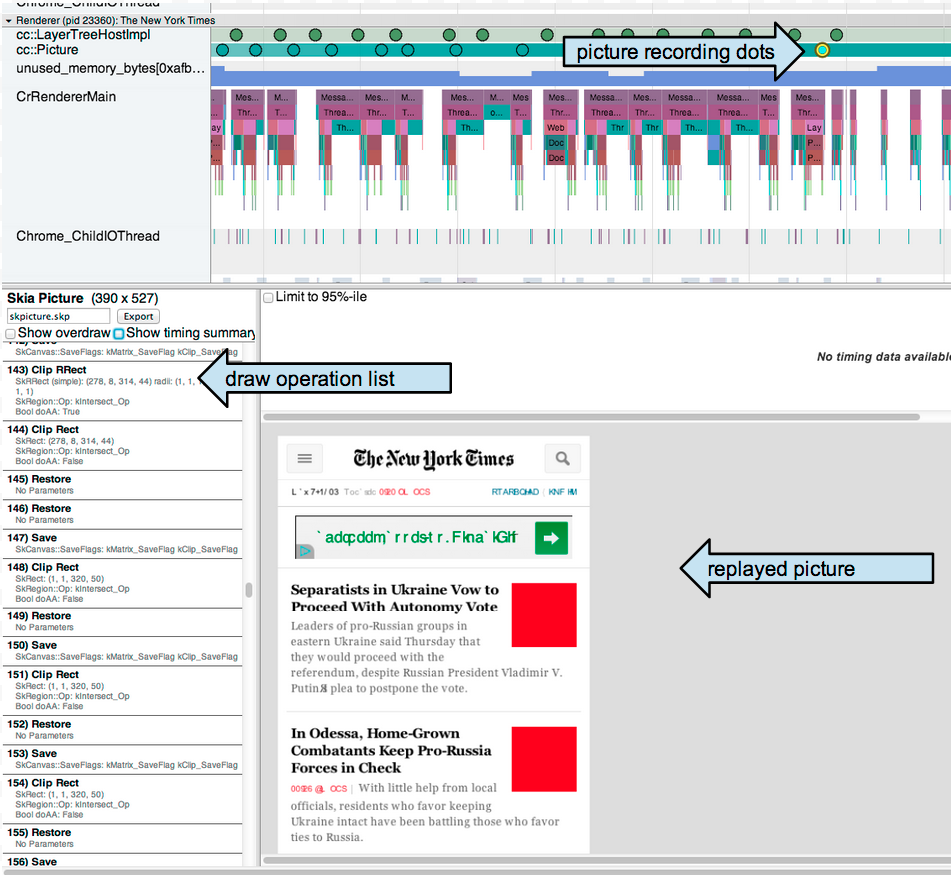
We can also get more info on the associated SkPicture for this layer for this frame by clicking the picture link. This opens up the SkPicture debugger:
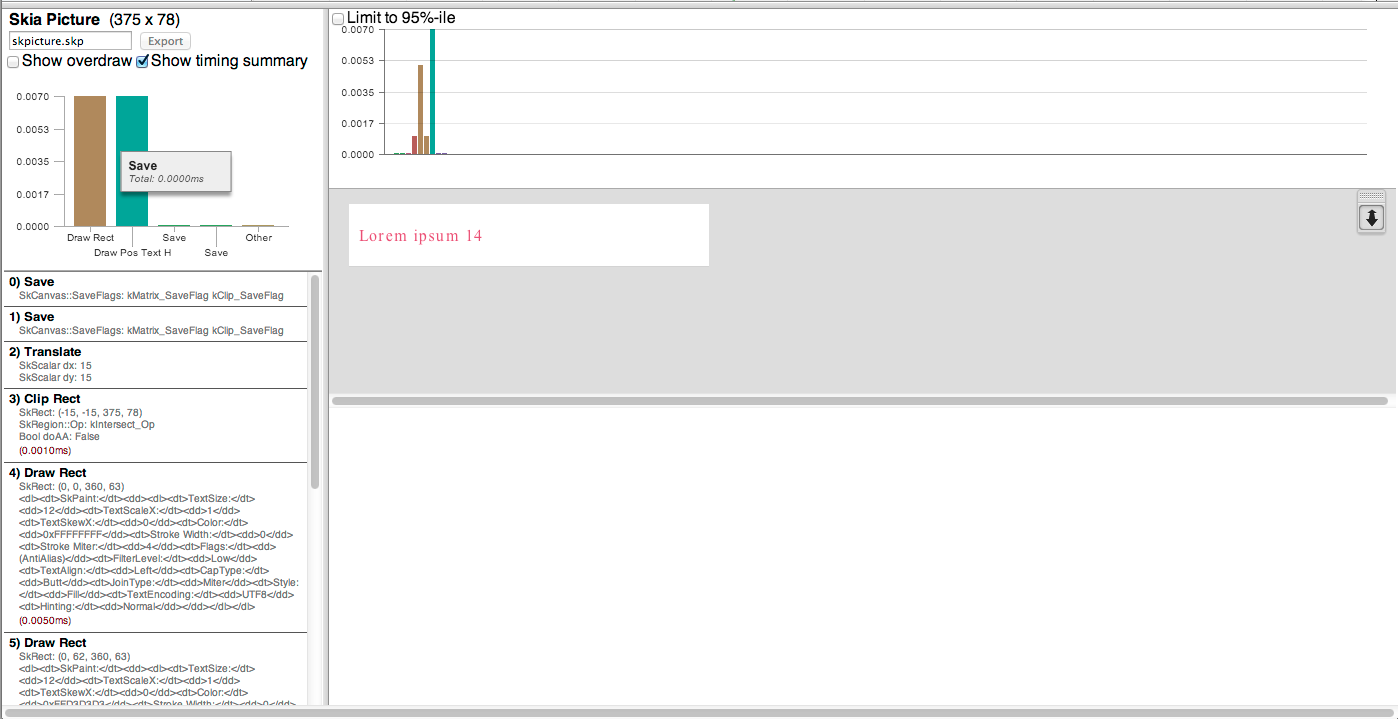
Which has a list of all the draw operations stored in the SkPiture on the left and a timing graph that shows the cost of each draw operations as a vertical line. Selecting vertical lines will replay the picture up to that point, which helps identify what a given draw op is doing and letting you understand what the most expensive draw operations in the SkPicture are.
Important caveat: this works by replaying the SkPicture locally, on the machine used to view tracing. That means that the timing information will not be an accurate representation of performance on the device the trace was taken on! Furthermore, at this point all picture playback in tracing uses the software rasterizer, even if the picture was actually rastered with Ganesh when displaying the frame originally! Despite these two big limitations, the picture debugger can still be helpful to understand relative operation costs.
Anatomy of a Performance Problem
Lastly, a couple isolated examples of performance problems. A real app usually has a combination of problems and may go beyond these simple examples, but these are common bottlenecks shown on their own.
Important caveat: tracing always imposes some amount of overhead on the browser’s regular operation. This is usually negligible for standard traces, but Frame Viewer traces are expensive and timing is not necessarily representative for Frame Viewer traces. It’s more useful to see what’s going on, rather than how long a particular operation took. In particular the DrawLayers operation on the compositor thread is expensive since it does most of the frame dump.
Excess Javascript / Touch Responsiveness
Remember, the JavaScript main thread is a web app’s UI thread. Here’s an example where a JS event handler that spends 50ms in V8 during the requestAnimationFrame callback gets in the way of touch events, causing a long stall in the rendering pipeline:
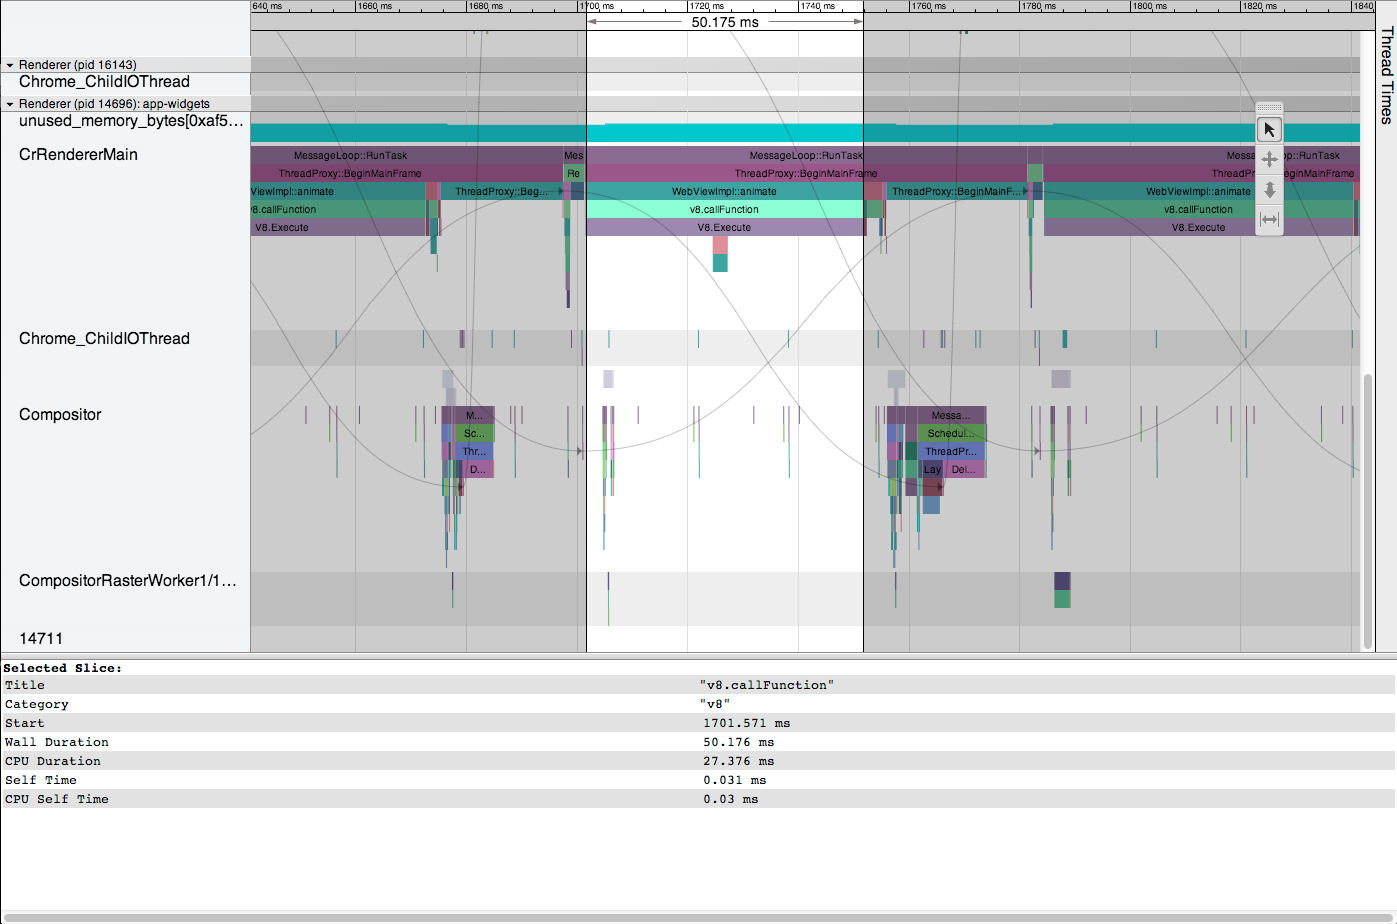
Note the compositor thread is essentially idle during this time since the main thread can’t run additional JavaScript to process new touch events while its busy running the long rAF callback. The user would not see a new Renderer frame during this period (jank).
The compositor is capable of running certain animations on its own (composited scroll and accelerated CSS animations), which it can run without waiting on JS. However with a touch event handler registered, as is the case on this page, the compositor thread must wait on the Blink main thread to process the touch event before responding to it by e.g. scrolling because JavaScript might call preventDefault on the touch event.
Unexpected Painting
Sometimes the only reasonable way to achieve an effect is to paint, but sometimes either Blink gets overeager and invalidates more than seems necessary or JavaScript manipulates style that invalidates more than it needs to.
Frame viewer is great for catching these cases.
For instance, look at this jsfiddle example from the Silk page set: http://jsfiddle.net/ugkd4/9/embedded/result/
Here’s a trace (trace file) of that animation running for a few seconds.
It’s supposed to demonstrate performing a clip with composited layers, so there shouldn’t be any painting going on. Stepping through the frames, though, we notice an odd invalidation at the beginning of each animation:
What’s that red rectangle doing there? Clicking on its associated layer and looking at layerName reveals it as “RenderButton BUTTON id=’button’”
OK, so what’s going on with the button? The main thread frame that produced this invalidation precedes it in the CrRendererMain timeline, and shows a JavaScript timer firing:
This makes sense, since referring to our example code the timer is firing once a second to restart the animation.
So we know something in that timer’s JS block caused a style recalculation (visible under the timer’s V8 execution block). Unfortunately there the trail goes cold, because we don’t know what style change did it. We can start commenting out style changes and seeing if the invalidation goes away, however.
A few rounds of that later, we have a simple reduction:
http://jsfiddle.net/3wMzq/1/embedded/result/
And its corresponding trace.
Nothing is changing on screen, and we’ve stripped out the additional DOM and all JavaScript except the empty click handler, which gets called once a second… and it’s still repainting!
At which point it becomes clear that this is in fact a bug in Chrome, which one files.
Happy hacking!